. 2014 May 19:9:18.
doi: 10.1186/1750-1326-9-18.

Hippocampal neuronal cells that accumulate α-synuclein fragments are more vulnerable to Aβ oligomer toxicity via mGluR5--implications for dementia with Lewy bodies

Affiliations

Hippocampal neuronal cells that accumulate α-synuclein fragments are more vulnerable to Aβ oligomer toxicity via mGluR5--implications for dementia with Lewy bodies

Cassia R Overk et al. Mol Neurodegener. .

Retraction in

Abstract

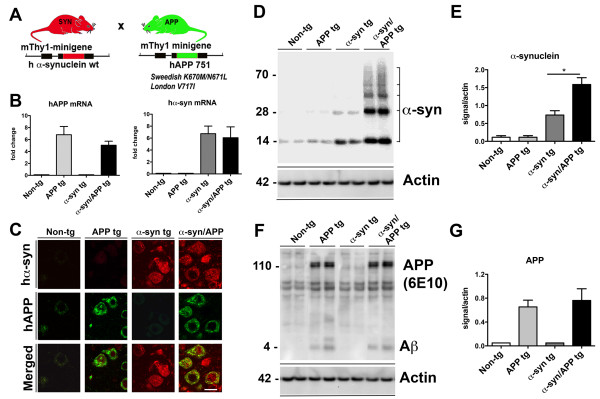
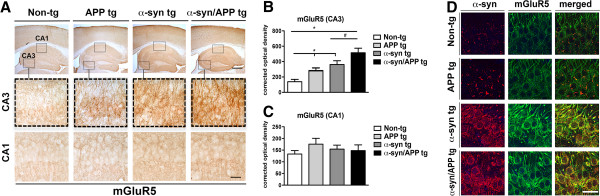
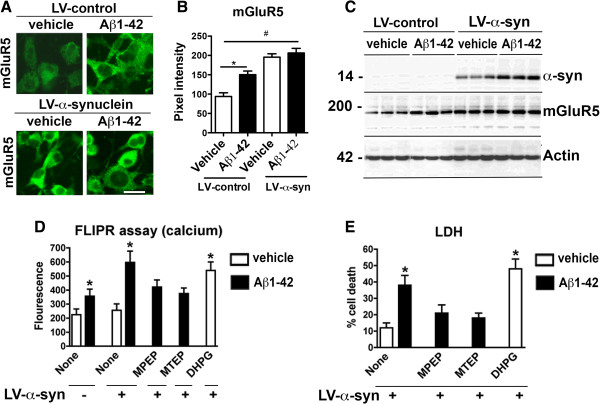
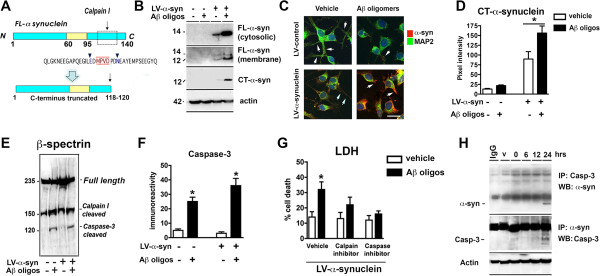
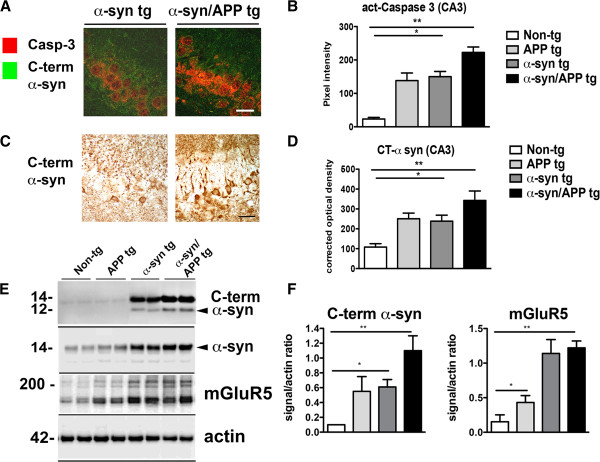
Background: In dementia with Lewy bodies (DLB) abnormal interactions between α-synuclein (α-syn) and beta amyloid (Aβ) result in selective degeneration of neurons in the neocortex, limbic system and striatum. However, factors rendering these neurons selectively vulnerable have not been fully investigated. The metabotropic glutamate receptor 5 (mGluR5) has been shown to be up regulated in DLB and might play a role as a mediator of the neurotoxic effects of Aβ and α-syn in vulnerable neuronal populations. In this context, the main objective of the present study was to investigate the role of mGluR5 as a mediator of the neurotoxic effects of α-syn and Aβ in the hippocampus.

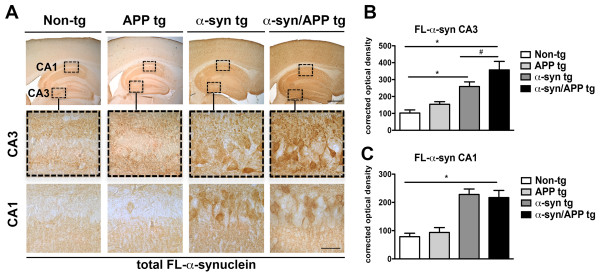
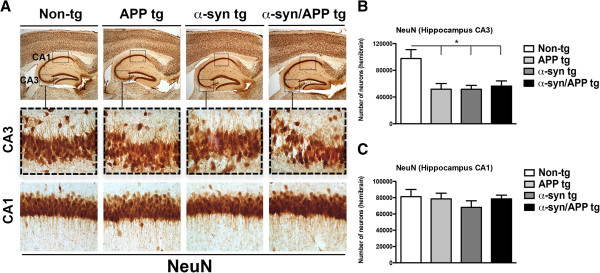
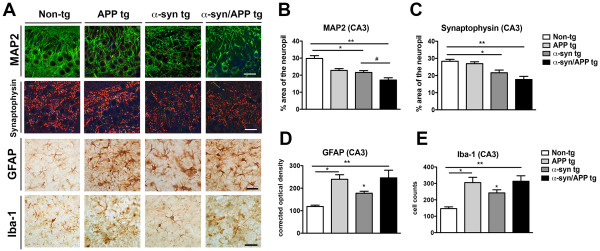
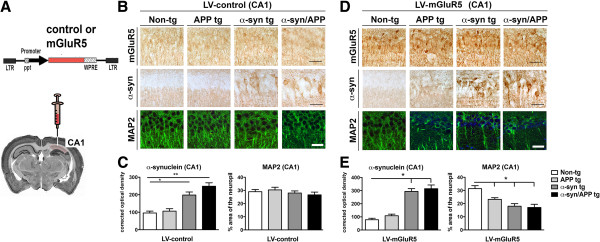
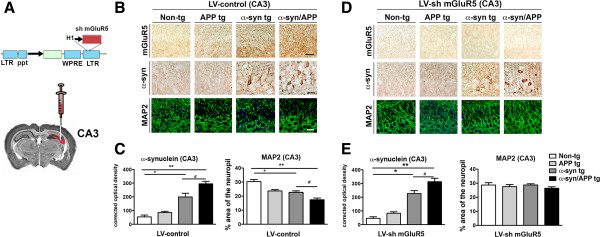
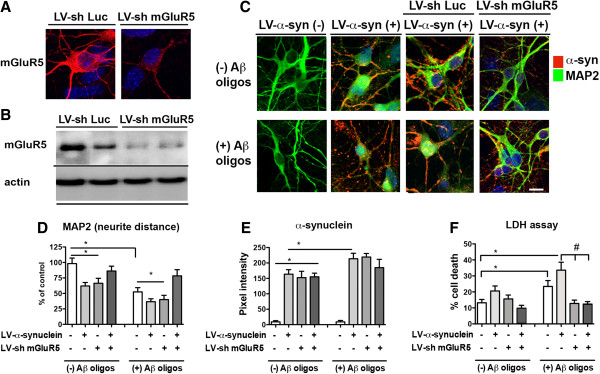
Results: We generated double transgenic mice over-expressing amyloid precursor protein (APP) and α-syn under the mThy1 cassette and investigated the relationship between α-syn cleavage, Aβ, mGluR5 and neurodegeneration in the hippocampus. We found that compared to the single tg mice, the α-syn/APP tg mice displayed greater accumulation of α-syn and mGluR5 in the CA3 region of the hippocampus compared to the CA1 and other regions. This was accompanied by loss of CA3 (but not CA1) neurons in the single and α-syn/APP tg mice and greater loss of MAP 2 and synaptophysin in the CA3 in the α-syn/APP tg. mGluR5 gene transfer using a lentiviral vector into the hippocampus CA1 region resulted in greater α-syn accumulation and neurodegeneration in the single and α-syn/APP tg mice. In contrast, silencing mGluR5 with a lenti-shRNA protected neurons in the CA3 region of tg mice. In vitro, greater toxicity was observed in primary hippocampal neuronal cultures treated with Aβ oligomers and over-expressing α-syn; this effect was attenuated by down-regulating mGluR5 with an shRNA lentiviral vector. In α-syn-expressing neuronal cells lines, Aβ oligomers promoted increased intracellular calcium levels, calpain activation and α-syn cleavage resulting in caspase-3-dependent cell death. Treatment with pharmacological mGluR5 inhibitors such as 2-Methyl-6-(phenylethynyl)pyridine (MPEP) and 3-((2-Methyl-4-thiazolyl)ethynyl)pyridine (MTEP) attenuated the toxic effects of Aβ in α-syn-expressing neuronal cells.

Conclusions: Together, these results support the possibility that vulnerability of hippocampal neurons to α-syn and Aβ might be mediated via mGluR5. Moreover, therapeutical interventions targeting mGluR5 might have a role in DLB.


Figures

Figure 1
Figure 1
Generation and characterization of tg mice expressing α-syn, APP or α-syn/APP under the mThy1 promoter. A. Schematic representation of the α-syn and APP single tg mice. B. Levels of hAPP mRNA and hα-syn mRNA expressed as a ratio to the housekeeping gene GAPDH in non-tg APP, α-syn, and α-syn/APP tg mice. Mice express comparable levels of hAPP mRNA in the APP and α-syn/APP tg mice, as well as similar levels of α-syn mRNA in the α-syn and α-syn/APP tg mice. C. Laser scanning confocal microscopy studies confirmed that in the α-syn/APP tg mice the same neuronal populations co-express human amyloid precursor protein (hAPP) and human α-syn (hα-syn); scale bar = 10 μm. D Representative Western blot and E analysis showed the presence of native α-syn (14 kDa) in the membrane fraction all mice with the most enhanced accumulation of α-syn (monomeric and oligomers) occurring in α-syn/APP mice when compared to the α-syn tg mice (p-value < 0.05). F. Representative Western blot and G analysis of hAPP revealed that full length APP and Aβ levels were comparable between APP tg and α-syn/APP tg mice and APP. For analysis, N = 6 mice (3–4 months old) from each line were utilized. * = p-value < 0.05 by one-way ANOVA with a Tukey-Kramer post hoc analysis.
Figure 2
Figure 2
Comparison of the patterns of full-length α-synuclein in the hippocampus of APP, α-syn, and α-syn/APP tg mice. Vibratome sections were immunostained with rabbit polyclonal antibody against full-length total α-syn (Millipore) A. Low- and high-magnification photomicrographs of the CA3 and CA1 regions of the hippocampus from non-tg, APP, α-syn, and α-syn/APP tg mice immunoreacted with anti-syn. Endogenous α-syn was observed in a punctate pattern in the neuropil of CA1 and CA3 in the non-tg and APP tg mice which was significantly enhanced in the α-syn and α-syn/APP tg mice. Moreover, α-syn and α-syn/APP tg mice also had α-syn in the neuronal cell bodies. B. Corrected optical densitometry analysis of the hippocampal CA3 region revealed that α-syn was significantly enhanced in both the α-syn and α-syn/APP tg mice compared to non-tg mice α-syn, and α-syn was significantly increased in the α-syn/APP double tg line compared with the α-syn single tg line. C. In the CA1, the increase in α-syn in α-syn tg line was equivalent to the increase in the α-syn/APP double tg line, which were both significantly increased compared to non-tg mice. Scale bars = 10 and 50 μm for the low and high magnifications, respectively. * = p-value < 0.05 by one-way ANOVA and Dunnett’s post hoc analysis compared to non-tg mice. # = p-value < 0.05 by one-way ANOVA and Tukey-Kramer post hoc analysis when, compared to α-syn/APP tg mice. For each analysis, N = 6 (3–4 months old) mice from each line were utilized.
Figure 3
Figure 3
Immunocytochemical analysis of mGluR5 in the hippocampus of APP, α-syn, and α-syn/APP tg mice. Vibratome sections were immunostained with an antibody against mGluR5. A. Low- and high-magnification photomicrographs of the CA3 and CA1 regions of the hippocampus from non-tg, APP, α-syn, and α-syn/APP tg mice immunoreacted with anti-mGluR5. Endogenous mGluR5 was observed in a punctate pattern in the neuropil of CA1 and CA3 in the non-tg mice. In the CA3, but not the CA1 the APP, α-syn, and α-syn/APP tg mice had mGluR5 in the neuronal cell bodies, and the punctate staining in the neuropil was significantly enhanced. B. Corrected optical densitometry analysis of the hippocampal CA3 region revealed that mGluR5 was significantly enhanced across all tg mice compared to non-tg mice α-syn, and mGluR5 was significantly increased in the α-syn/APP double tg line compared with the α-syn single tg line. C. In the CA1, there was no significant difference in the amount of mGluR5 in any of the tg line compared to the non-tg line. D. Confocal imaging of CA3 hippocampus double-labeled with α-syn and mGLuR5 confirmed the presence and increase in mGluR5 with α-syn in both the α-syn and α-syn/APP tg mice. Scale bars = 10 and 50 μm for the low and high magnifications, respectively. * = p-value < 0.05 by one-way ANOVA and Dunnett’s post hoc analysis compared to non-tg mice. # = p-value < 0.05 by one-way ANOVA and Tukey-Kramer post hoc analysis when, compared to α-syn/APP tg mice. For each analysis, N = 6 (3–4 months old) mice from each line were utilized.
Figure 4
Figure 4
Decreased number of hippocampal CA3 but not CA1 pyramidal cells in APP, α-syn, and α-syn/APP tg mice. A. Representative low- and high-photomicrographs of the hippocampal CA3 and CA1 regions of sections immunoreacted with NeuN. B. Stereological assessment of every 12th section revealed a significant decrease in the number of neurons in the CA3. C. However, the number of neurons in the CA1 region was unaffected across all tg mouse line. Statistical analysis was conducted using one-way ANOVA post hoc Dunnett’s compared to non-tg mice; * p-value < 0.05. For analysis N = 3 (3–4 mos old) from each line were utilized.
Figure 5
Figure 5
Hippocampal CA3 brain region selectively vulnerable in APP, α-syn, and α-syn/APP tg mice. Immunocytochemical analysis was performed in the hippocampal CA3 pyramidal layer. A. Representative confocal, MAP 2- (dendritic marker) and synaptophysin- (pre-synaptic terminal marker), and photomicrographs of GFAP- (astroglial cells) and Iba-1- (microglial cells) ir. MAP 2-ir found in neuronal cell bodies and dendrites, was reduced in APP, α-syn and α-syn/APP tg mice. Synaptophysin was abundant in punctate staining in non-tg pre-synaptic nerve terminals and reduced in α-syn and α-syn/APP tg mice. GFAP-positive astroglial cells had small cell bodies with short processes in the non-tg mice, while APP, α-syn, and α-syn/APP tg mice had GFAP-positive astroglia with enlarged cell bodies and extended processes. Non-tg mice displayed strongly immunoreactive discrete Iba-1-immunoreactive microglia, which increased in APP, α-syn and α-syn/APP tg mice B. The percent area of MAP 2-ir neuropil was significantly decreased in all tg lines compared to non-tg mice, with the greatest loss in the α-syn/APP double tg mice. C. The percent of synaptophysin-ir neuropil area revealed a significant reduction in α-syn tg mice and further reduction in α-syn/APP tg mice. D. Optical density image analysis revealed a significant increase in GFAP-ir in the APP and α-syn tg mice, which was greatest in α-syn/APP double tg mice compared to non-tg mice. E. Image analysis confirmed a significant increase in the number of Iba-1-positive cells in APP and α-syn single tg mice, which was greatest in α-syn/APP double tg mice. * = p-value < 0.05 and ** = p-value < 0.01 by one-way ANOVA and Dunnett’s post hoc analysis compared to non-tg mice. # = p-value < 0.05 by one-way ANOVA and Tukey-Kramer post hoc analysis when compared to α-syn/APP tg mice. For each analysis, N = 6 (3–4 months old) mice from each line were utilized.
Figure 6
Figure 6
Creating mGLuR5-mediated vulnerability in the CA1 region via lentivirus delivery in vivo. A. Schematic representation of lentivirus expressing either control vector or mGLuR5 that was injected unilaterally in the CA1 of the hippocampus. B. Representative photomicrographs and C image analysis of sections from mice injected with LV-control and immunoreacted with mGluR5, α-syn and MAP 2. Injecting LV-control had no effect on either non-tg or tg mice and was comparable to the initial characterization of these mice in which levels of mGLuR5 remained the same, α-syn increased in α-syn and α-syn/APP tg mice, and MAP 2-ir was unaffected. D. Representative photomicrographs and E. image analysis revealed that injection of the LV-mGluR5 resulted in a significant increase in mGluR5 in the neuronal cell bodies and dendrites in the CA1 of the hippocampus in the non-tg and tg lines. While α-syn remained unaffected by LV-mGluR5 with α-syn increased in α-syn and α-syn/APP tg mice, MAP 2-ir was significantly reduced in dendrites in the CA1 region. * = p-value < 0.05 and ** = p-value < 0.01 by one-way ANOVA and Dunnett’s post hoc analysis compared to non-tg mice. For each analysis, N = 6 (3–4 months old) mice from each line were utilized.
Figure 7
Figure 7
Down-regulation of mGLuR5 in the CA3 region via shRNA lentivirus delivery is protective. A. Schematic representation of lentivirus expressing either control vector or sh mGLuR5 that was injected unilaterally in the CA3 of the hippocampus. B. Representative photomicrographs and C image analysis of sections from mice injected with LV-control and immunoreacted with mGluR5, α-syn and MAP 2. Injecting LV-control had no effect on either non-tg or tg mice and was comparable to the initial characterization of these mice in which levels of mGLuR5, α-syn, and MAP 2-ir. D. Representative photomicrographs and E. image analysis revealed that injection of the LV-sh mGluR5 resulted in a significant reduction in mGluR5 in the neuronal cell bodies and dendrites in the CA3 of the hippocampus in the non-tg and tg lines. While α-syn remained unaffected by LV-sh mGluR5 with α-syn increased in α-syn and α-syn/APP tg mice, levels of MAP 2-ir were improved in the CA3 region. * = p-value < 0.05 and ** = p-value < 0.01 by one-way ANOVA and Dunnett’s post hoc analysis compared to non-tg mice. # = p-value < 0.05 by one-way ANOVA and Tukey-Kramer post hoc analysis when compared to α-syn/APP tg mice. For each analysis, N = 6 (3–4 months old) mice from each line were utilized.
Figure 8
Figure 8
Blocking mGLuR5-mediated neuronal vulnerability to Aβ and α-syn in the hippocampal neurons via lentivirus shRNA delivery in vitro. A. Confocal imaging and B Western blot of primary neuronal hippocampal cells, which endogenously express mGluR5. LV-sh-luciferase (control LV-sh) had no effect on the expression of mGluR5, while LV-sh-mGluR5 effectively reduced endogenous mGluR5 expression by 80%. C. Confocal microscopy of neuronal cells co-infected with LV-control or LV-α-syn in the presence of either LV-sh-Luc or LV-sh-mGluR5 and treated with vehicle or Aβ oligomers and double labeled with antibodies against α-syn and MAP 2. D. Image analysis revealed that neurite distance (MAP 2) was reduced 35-40% in neuronal cells infected with LV-α-syn, and when this system was challenged with Aβ oligomers, neurite length was further reduced to 40-50% of control. While LV-sh-Luc had no effect on neurite length in either the presence or absence of Aβ oligomers, down modulation of mGluR5 using LV-sh-mGluR5 rescued neurite length in neuronal cells treated with LV-α-syn, as well as with the combined toxicity of LV-α-syn and Aβ oligomers. E. Image analysis of α-syn revealed that neuronal cells infected with LV-α-syn expressed higher levels of α-syn compared to untreated cells, and that Aβ oligomers further increased this expression compared with cells only treated with LV-α-syn. Down modulation of mGluR5 with LV-sh-mGluR5 had no effect on α-syn levels. F. Neuronal survival by LDH, showing that down-modulation of mGluR5 is protective form the toxic effects of Aβ oligomers and α-syn. * = p-value < 0.05 by one-way ANOVA and Dunnett’s post hoc analysis compared to vehicle-treated uninfected neurons. # = p < 0.05 by one-way ANOVA and Tukey-Kramer post hoc analysis when compared to LV-α-syn + Aβ oligomers.
Figure 9
Figure 9
α-Synuclein and Aβ effect mGluR5 to promote toxicity via increase intracellular calcium flux. The co-pathogenic mechanisms of Aβ and α-syn toxicity were investigated in the B103 rat neuroblastoma cells infected with LV-α-syn and treated with Aβ oligomers. A. Immunocytochemistry, B image analysis and C. Western blot analysis of the levels of mGluR5 in B103 cells revealed the lowest levels in vehicle treated cells. mGluR5 was significantly increased in cells treated with Aβ or LV-α-syn alone; and mGluR5 levels were the highest in cells treated with both Aβ and LV-α-syn. Aβ increased levels of α-syn in cells where both were present. D. Intracellular calcium levels, as measured using the fluorescence-based FLIPR assay, revealed that Aβ treatment resulted in a two-fold increase in intracellular calcium compared to control cells. While LV-α-syn had no effect on its own, in combination with Aβ there was a three-fold increase in intracellular calcium, which was similar to the effect of treating cells with the mGluR5 agonist DHPG. Pretreating B103 cells with mGluR5 antagonists MPEP and MTEP prior to Aβ and LV-α-syn exposure attenuated the intracellular calcium increase. E. In the lactate dehydrogenase (LDH) toxicity assay, B103 cells were unaffected by LV-α-syn; however, the percent cell death dramatically increased when LV-α-syn was combined with Aβ oligomers. The mGluR5 agonist DHPG caused a similar level of cell death, while pretreatment with the mGluR5 antagonists MPEP and MTEP attenuated the neurotoxic effects and reduced cell death to levels similar to LV-α-syn alone. * = p-value < 0.05 by one-way ANOVA and Dunnett’s post hoc analysis compared to vehicle-treated control.
Figure 10
Figure 10
Aβ promotes calpain mediated α-syn fragmentation and caspase-3 dependent cell death in α-syn-expressing neuronal cells. A. Diagrammatic representation of calpain-mediated α-syn cleavage resulting in C-terminus truncation of α-syn. B. Representative Western blot showing increased levels in both FL-α-syn (14 kDa) in the cytosolic (single band) and membrane (double band) fractions, as wells as an increase in C-terminus cleavage of α-syn (12 kDa) when cells were pre-treated with Aβ. C. Representative confocal microscopy and D image analysis of B103 neuroblastoma cells treated with combinations of LV-α-syn and/or Aβ oligomers revealed increased CT-α-syn-ir (* p < 0.05; one-way ANOVA and Dunnett’s post hoc analysis compared to LV-α-syn treated with vehicle). E. Increased β-spectrin degradation by calpain and caspase-3, in the presence of LV-α-syn and Aβ. F. Caspase-3 activity was increased in cells treated with Aβ alone and combined with LV-α-syn. * p < 0.05; one-way ANOVA and Dunnett’s post hoc analysis compared to uninfected, vehicle-treated control. G. Calpain and caspase inhibitors rescued cell death induced by combined toxicity of Aβ and LV-α-syn. H. Co-ip of α-syn and caspase-3 in the presence of Aβ.
Figure 11
Figure 11
Accumulation of CT α-syn and caspase-3 activation in α-syn/APP tg mice. A. Confocal images and B image analysis of increased caspase-3 activation in the hippocampal CA3 region. While caspase-3 was significantly increased in all tg lines compared to non-tg mice, the most dramatic increase was in the α-syn/APP tg mice. C. Photomicrographs and D image analysis of C-terminal α-syn accumulation of α-syn CT fragments. Accumulation of CT-α-syn was significant in the α-syn tg line and was most significantly increased in the α-syn/APP tg line. E. Representative Western blot and F. immunoblot analysis showing increased levels of α-syn CTF and mGluR5 in APP, SYN, and SYN/APP tg mice. * = p-value < 0.05, and ** = p-value < 0.01 by one-way ANOVA and Dunnett’s post hoc analysis compared to non-tg mice. For each analysis, N = 6 (3–4 months old) mice from each line were utilized.

References

    1. As A. Alzheimer’s disease facts and figures. Alzheimer’s Dementia. 2013;2013(9):1–71. - PubMed
    1. Masters CL, Selkoe DJ. Biochemistry of amyloid beta-protein and amyloid deposits in Alzheimer disease. Cold Spring Harb Perspect Med. 2012;2:a006262. - PMC - PubMed
    1. Mucke L, Selkoe DJ. Neurotoxicity of amyloid beta-protein: synaptic and network dysfunction. Cold Spring Harb Perspect Med. 2012;2:a006338. - PMC - PubMed
    1. Trojanowski J, Goedert M, Iwatsubo T, Lee V. Fatal attractions: abnormal protein aggregation and neuron death in Parkinson’s disease and lewy body dementia. Cell Death Differ. 1998;5:832–837. doi: 10.1038/sj.cdd.4400432. - DOI - PubMed
    1. Spillantini MG, Schmidt ML, Lee VM, Trojanowski JQ, Jakes R, Goedert M. Alpha-synuclein in Lewy bodies. Nature. 1997;388:839–840. doi: 10.1038/42166. - DOI - PubMed

Publication types

MeSH terms