. 2014 May 2;15(1):331.
doi: 10.1186/1471-2164-15-331.

Nucleosome positioning and histone modifications define relationships between regulatory elements and nearby gene expression in breast epithelial cells

Affiliations

Nucleosome positioning and histone modifications define relationships between regulatory elements and nearby gene expression in breast epithelial cells

Suhn Kyong Rhie et al. BMC Genomics. .

Abstract

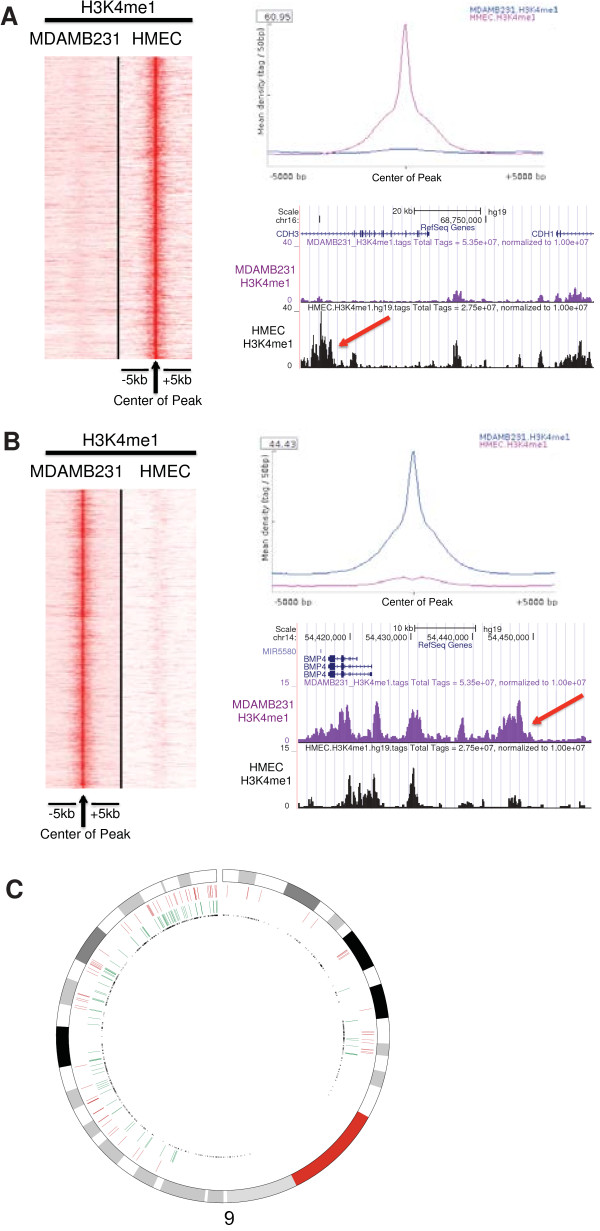
Background: The precise nature of how cell type specific chromatin structures at enhancer sites affect gene expression is largely unknown. Here we identified cell type specific enhancers coupled with gene expression in two different types of breast epithelial cells, HMEC (normal breast epithelial cells) and MDAMB231 (triple negative breast cancer cell line).

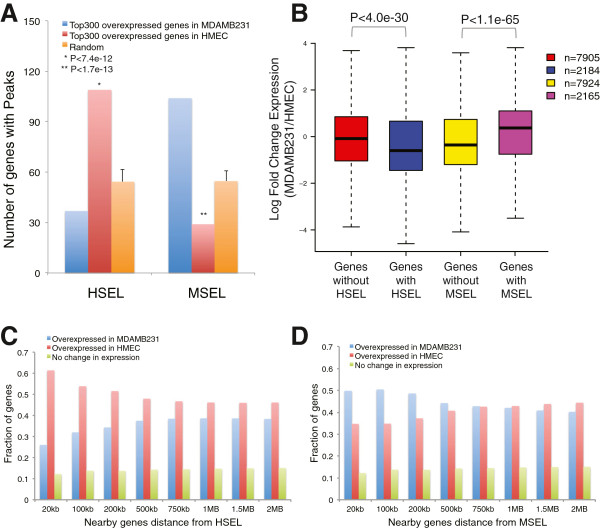
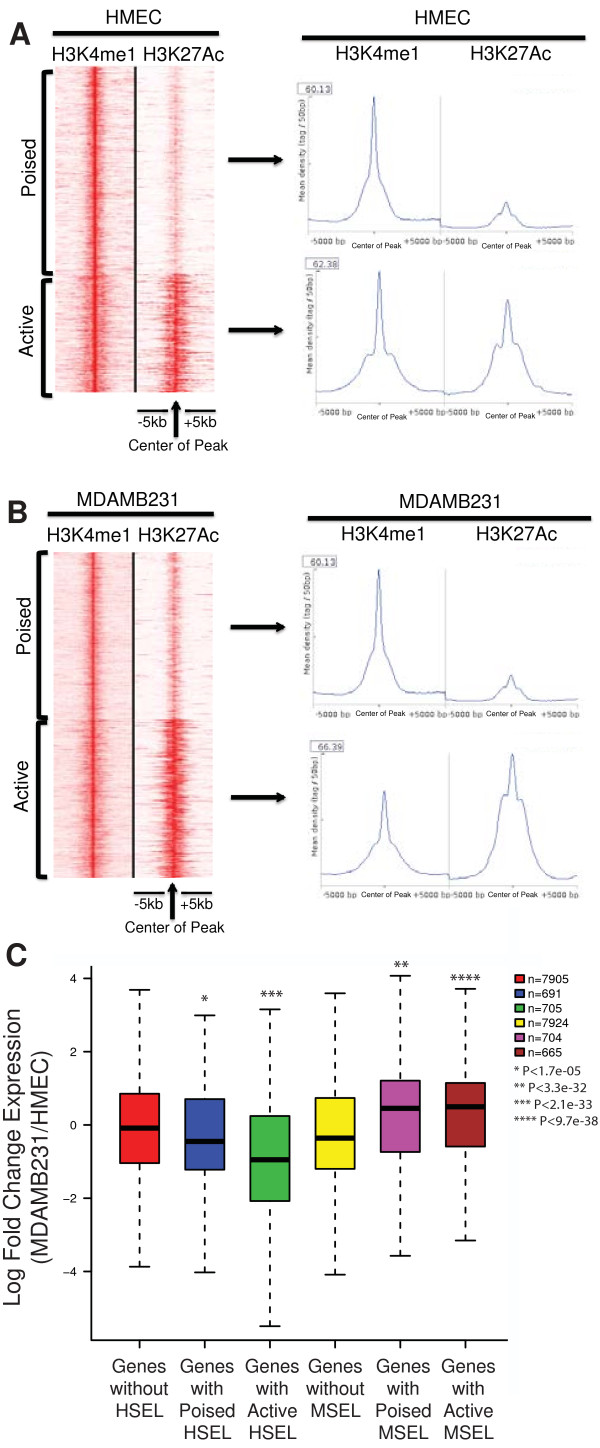
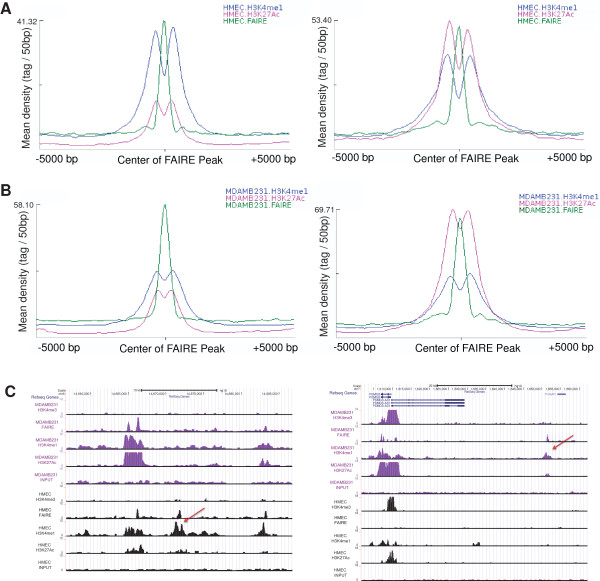
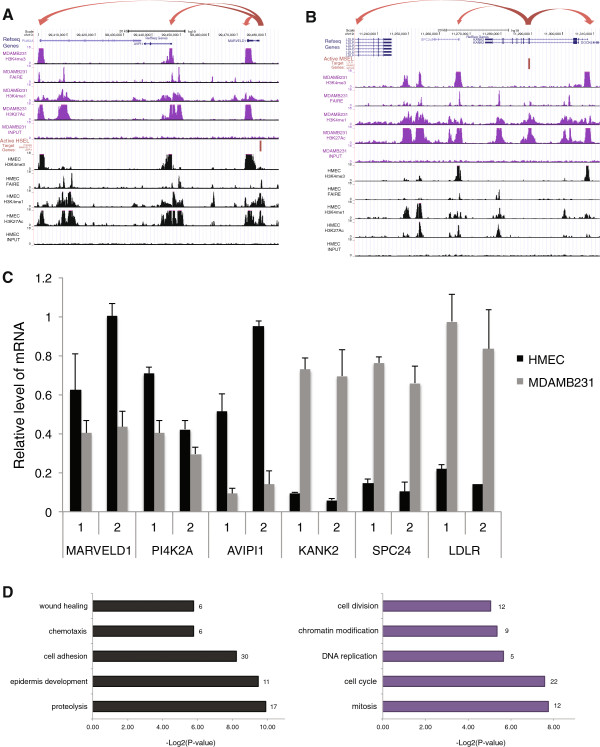
Results: Enhancers were defined by modified neighboring histones [using chromatin immunoprecipitation followed by sequencing (ChIP-seq)] and nucleosome depletion [using formaldehyde-assisted isolation of regulatory elements followed by sequencing (FAIRE-seq)]. Histone modifications at enhancers were related to the expression levels of nearby genes up to 750 kb away. These expression levels were correlated with enhancer status (poised or active), defined by surrounding histone marks. Furthermore, about fifty percent of poised and active enhancers contained nucleosome-depleted regions. We also identified response element motifs enriched at these enhancer sites that revealed key transcription factors (e.g. TP63) likely involved in regulating breast epithelial enhancer-mediated gene expression. By utilizing expression data, potential target genes of more than 600 active enhancers were identified. These genes were involved in proteolysis, epidermis development, cell adhesion, mitosis, cell cycle, and DNA replication.

Conclusions: These findings facilitate the understanding of epigenetic regulation specifically, such as the relationships between regulatory elements and gene expression and generally, how breast epithelial cellular phenotypes are determined by cell type specific enhancers.


Figures

Figure 1
Figure 1
Cell type specific enhancer loci identification in breast epithelial cells (HMEC and MDAMB231). (A) H3K4me1 ChIP-seq tags from both cells at the center of HMEC specific enhancer loci (HSEL) were graphed in the heatmap (red: higher density) (left). Mean density of H3K4me1 ChIP-seq tags from both cells at the HSEL (top right). An example of the HSEL was located in the intron of CDH3 gene, near CDH1 gene (red arrow) (bottom right). (B) H3K4me1 ChIP-seq tags from both cells at the center of MDAMB231 specific enhancer loci (MSEL) were graphed in the heatmap (red: higher density) (left). Mean density of H3K4me1 ChIP-seq tags from both cells at the MSEL (top right). An example of the MSEL located 20 kb upstream of the BMP4 gene (red arrow) (bottom right). (C) Genomic distribution of cell type specific enhancer loci in chromosome 9 (red: HSEL, green: MSEL, black: transcription start sites).
Figure 2
Figure 2
Expression level of nearby genes of the HSEL and MSEL. (A) Number of genes with cell type specific enhancer loci (i.e. HSEL, MSEL) from top 300 overexpressed genes in MDAMB231 (blue), top 300 overexpressed genes in HMEC (red), and three randomly selected 300 gene datasets as controls (orange). The enrichment of genes with cell type specific enhancer loci in each group was calculated by performing chi-square test between groups. (B) Log fold change of nearby gene expression boxplot for the HSEL and MSEL (in windows of 100 kb). Student t-test was applied between groups in order to calculate p-values. Nearby genes of cell type specific enhancer loci (HSEL (C), MSEL (D)) were categorized to three groups; overexpressed genes in MDAMB231 (blue), overexpressed genes in HMEC (red), and no change in gene expression (green), and fraction of genes for each category was graphed. Eight different window sizes were used for the nearby gene distance from cell type specific enhancer loci: from 20 kb windows of cell type specific enhancer loci (±20 kb of HSEL/MSEL) up to 2 Mb windows (±2 Mb of HSEL/MSEL).
Figure 3
Figure 3
Poised and active enhancers. (A) H3K4me1 and H3K27Ac ChIP-seq tags from HMEC at the HSEL were graphed in the heatmap (red: higher density) (left). Mean density of H3K4me1 and H3K27Ac ChIP-seq tags from HMEC at the poised HSEL (top right) and the active HSEL (bottom right) (B) H3K4me1 and H3K27Ac ChIP-seq tags from MDAMB231 at the MSEL were graphed in the heatmap (red: higher density) (left). Mean density of H3K4me1 and H3K27Ac ChIP-seq tags from MDAMB231 at the poised MSEL (top right) and the active MSEL (bottom right) (C) Log fold change of nearby gene expression boxplot for the poised/active HSEL and poised/active MSEL. Student t-test was applied between groups in order to calculate p-values.
Figure 4
Figure 4
Poised and active enhancers with FAIRE signals. (A) Mean density of H3K4me1, H3K27Ac ChIP-seq, and FAIRE-seq tags from HMEC at the center of poised (left) or active (right) HSEL, which were intersected with HMEC FAIRE (B) Mean density of H3K4me1, H3K27Ac ChIP-seq, and FAIRE-seq tags from MDAMB231 at the center of poised (left) or active (right) MSEL, which were intersected with MDAMB231 FAIRE (C) UCSC genome browser screenshots for examples of poised cell type specific enhancer loci with FAIRE signal (left: poised HSEL, right: poised MSEL)
Figure 5
Figure 5
Identification of target genes, which may be regulated by cell type specific enhancers. (A) UCSC genome browser screenshot for an example of active HSEL (red bar) and their putative target genes (red arrows) (B) UCSC genome browser screenshot for an example of active MSEL (red bar) and their putative target genes (red arrows) (C) Quantitative real-time RT-PCR analysis of putative target genes of active HSEL (i.e. MARVELD1, PI4K2A, AVIPI1) and active MSEL (i.e. KANK2, SPC24, LDLR). Two primer sets located in the exons of each gene were used, and the expression levels were presented relative to GAPDH expression. The error bars indicated the standard deviations from triplicate in HMEC (black) and MDAMB231 (grey). (D) Gene ontology process categories, which were differentially enriched in the putative target genes of active HSEL (black) and active MSEL (purple). x-axis indicated the -Log2 of p-value, calculated by performing chi-square between groups. The number of genes belonged to each GO category was shown on the right side of the bar.

References

    1. Collins FS, Green ED, Guttmacher AE, Guyer MS. A vision for the future of genomics research. Nature. 2003;422:835–847. doi: 10.1038/nature01626. - DOI - PubMed
    1. Huisinga KL, Brower-Toland B, Elgin SC. The contradictory definitions of heterochromatin: transcription and silencing. Chromosoma. 2006;115:110–122. doi: 10.1007/s00412-006-0052-x. - DOI - PubMed
    1. Grewal SI, Jia S. Heterochromatin revisited. Nat Rev Genet. 2007;8:35–46. doi: 10.1038/nrg2008. - DOI - PubMed
    1. Ong CT, Corces VG. Enhancer function: new insights into the regulation of tissue-specific gene expression. Nat Rev Genet. 2011;12:283–293. doi: 10.1038/nrg2957. - DOI - PMC - PubMed
    1. Heintzman ND, Stuart RK, Hon G, Fu Y, Ching CW, Hawkins RD, Barrera LO, Van Calcar S, Qu C, Ching KA, Wang W, Green RD, Crawford GE, Ren B. Distinct and predictive chromatin signatures of transcriptional promoters and enhancers in the human genome. Nat Genet. 2007;39:311–318. doi: 10.1038/ng1966. - DOI - PubMed

Publication types