

Evaluating the possibility of detecting evidence of positive selection across Asia with sparse genotype data from the HUGO Pan-Asian SNP Consortium
- PMID: 24885517
- PMCID: PMC4035063
- DOI: 10.1186/1471-2164-15-332
Evaluating the possibility of detecting evidence of positive selection across Asia with sparse genotype data from the HUGO Pan-Asian SNP Consortium
Abstract
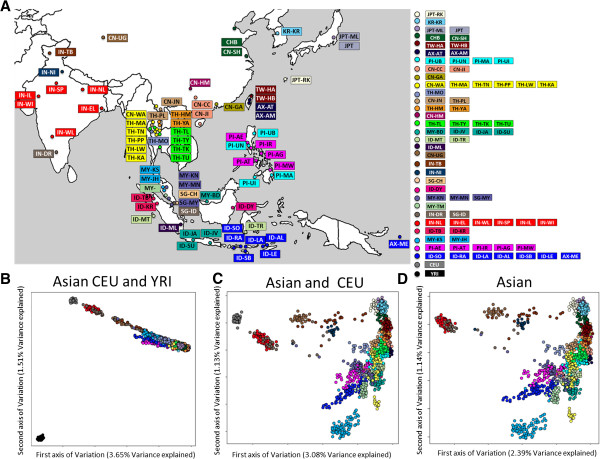
Background: The HUGO Pan-Asian SNP Consortium (PASNP) has generated a genetic resource of almost 55,000 autosomal single nucleotide polymorphisms (SNPs) across more than 1,800 individuals from 73 urban and indigenous populations in Asia. This has offered valuable insights into the correlation between the genetic ancestry of these populations with major linguistic systems and geography. Here, we attempt to understand whether adaptation to local climate, diet and environment partly explains the genetic variation present in these populations by investigating the genomic signatures of positive selection.
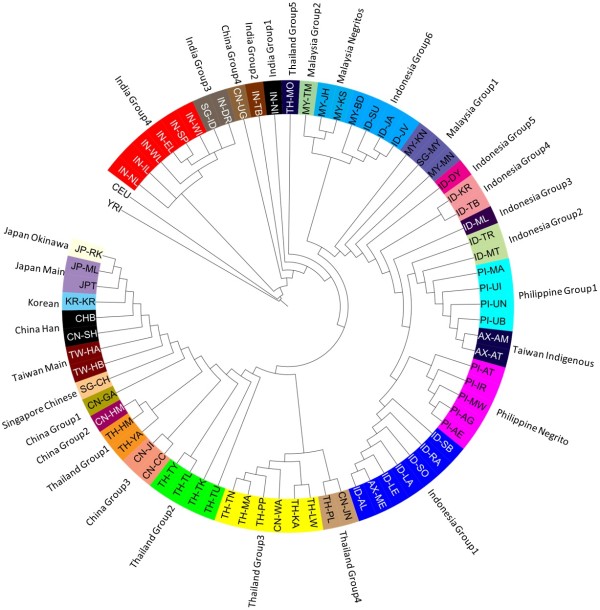
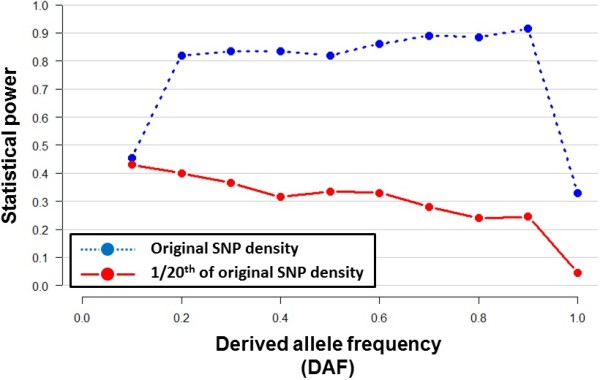
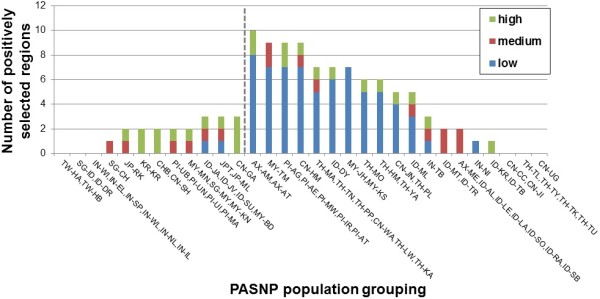
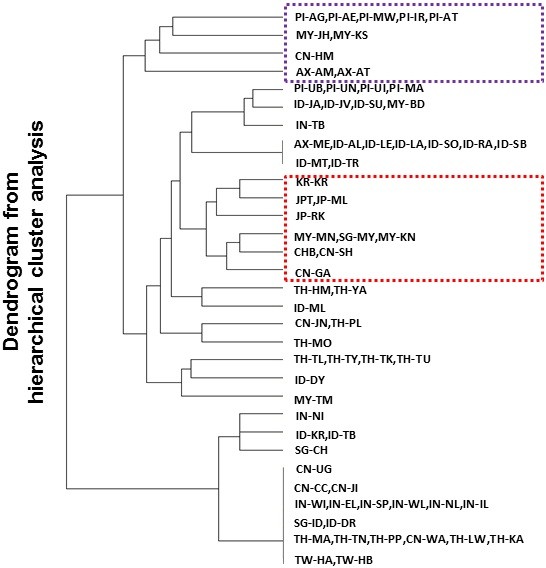
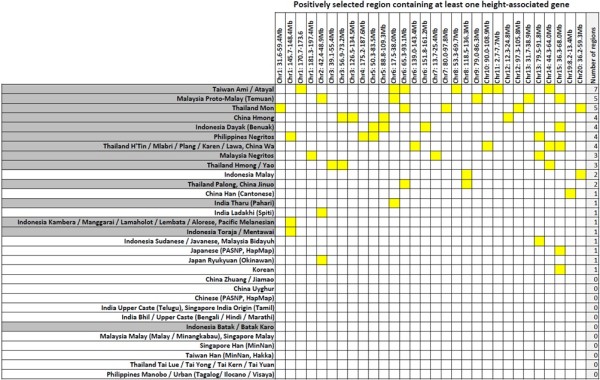
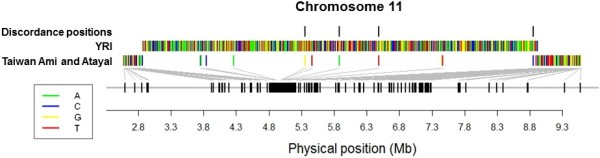
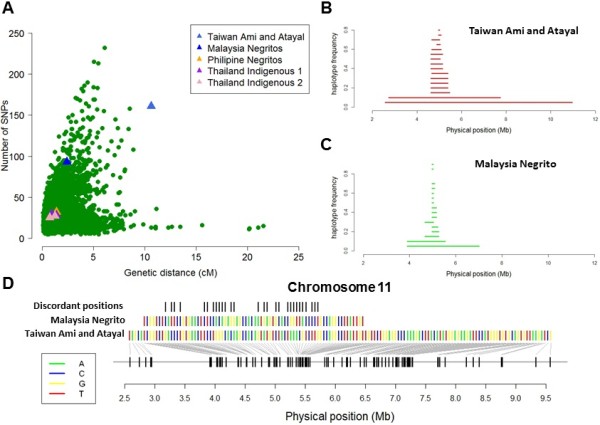
Results: To evaluate the impact to the selection analyses due to the considerably lower SNP density as compared to other population genetics resources such as the International HapMap Project (HapMap) or the Singapore Genome Variation Project, we evaluated the extent of haplotype phasing switch errors and the consistency of selection signals from three haplotype-based approaches (iHS, XP-EHH, haploPS) when the HapMap data is thinned to a similar density as PASNP. We subsequently applied haploPS to detect and characterize positive selection in the PASNP populations, identifying 59 genomics regions that were selected in at least one PASNP populations. A cluster analysis on the basis of these 59 signals showed that indigenous populations such as the Negrito from Malaysia and Philippines, the China Hmong, and the Taiwan Ami and Atayal shared more of these signals. We also reported evidence of a positive selection signal encompassing the beta globin gene in the Taiwan Ami and Atayal that was distinct from the signal in the HapMap Africans, suggesting the possibility of convergent evolution at this locus due to malarial selection.
Conclusions: We established that the lower SNP content of the PASNP data conferred weaker ability to detect signatures of positive selection, but the availability of the new approach haploPS retained modest power. Out of all the populations in PASNP, we identified only 59 signals, suggesting a strong need for high-density population-level genotyping data or sequencing data in order to achieve a comprehensive survey of positive selection in Asian populations.
Figures
Similar articles
-
Characterising private and shared signatures of positive selection in 37 Asian populations.Eur J Hum Genet. 2017 Apr;25(4):499-508. doi: 10.1038/ejhg.2016.181. Epub 2017 Jan 18. Eur J Hum Genet. 2017. PMID: 28098149 Free PMC article.
-
Singapore Genome Variation Project: a haplotype map of three Southeast Asian populations.Genome Res. 2009 Nov;19(11):2154-62. doi: 10.1101/gr.095000.109. Epub 2009 Aug 21. Genome Res. 2009. PMID: 19700652 Free PMC article.
-
Natural positive selection and north-south genetic diversity in East Asia.Eur J Hum Genet. 2012 Jan;20(1):102-10. doi: 10.1038/ejhg.2011.139. Epub 2011 Jul 27. Eur J Hum Genet. 2012. PMID: 21792231 Free PMC article.
-
PanSNPdb: the Pan-Asian SNP genotyping database.PLoS One. 2011;6(6):e21451. doi: 10.1371/journal.pone.0021451. Epub 2011 Jun 23. PLoS One. 2011. PMID: 21731755 Free PMC article.
-
The search for loci under selection: trends, biases and progress.Mol Ecol. 2018 Mar;27(6):1342-1356. doi: 10.1111/mec.14549. Epub 2018 Mar 30. Mol Ecol. 2018. PMID: 29524276 Review.
Cited by
-
Characterising private and shared signatures of positive selection in 37 Asian populations.Eur J Hum Genet. 2017 Apr;25(4):499-508. doi: 10.1038/ejhg.2016.181. Epub 2017 Jan 18. Eur J Hum Genet. 2017. PMID: 28098149 Free PMC article.
-
Evaluation of optimal methods and ancestries for calculating polygenic risk scores in East Asian population.Sci Rep. 2023 Nov 6;13(1):19195. doi: 10.1038/s41598-023-45859-w. Sci Rep. 2023. PMID: 37932343 Free PMC article.
-
Uncovering Adaptation from Sequence Data: Lessons from Genome Resequencing of Four Cattle Breeds.Genetics. 2016 May;203(1):433-50. doi: 10.1534/genetics.115.181594. Epub 2016 Mar 26. Genetics. 2016. PMID: 27017625 Free PMC article.
-
Detecting signatures of positive selection associated with musical aptitude in the human genome.Sci Rep. 2016 Feb 16;6:21198. doi: 10.1038/srep21198. Sci Rep. 2016. PMID: 26879527 Free PMC article.
-
Differential positive selection of malaria resistance genes in three indigenous populations of Peninsular Malaysia.Hum Genet. 2015 Apr;134(4):375-92. doi: 10.1007/s00439-014-1525-2. Epub 2015 Jan 30. Hum Genet. 2015. PMID: 25634076
References
-
- Tishkoff SA, Reed FA, Friedlaender FR, Ehret C, Ranciaro A, Froment A, Hirbo JB, Awomoyi AA, Bodo JM, Doumbo O, Ibrahim M, Juma AT, Kotze MJ, Lema G, Moore JH, Mortensen H, Nyambo TB, Omar SA, Powell K, Pretorius GS, Smith MW, Thera MA, Wambebe C, Weber JL, Williams SM. The genetic structure and history of Africans and African Americans. Science. 2009;324(5930):1035–1044. doi: 10.1126/science.1172257. - DOI - PMC - PubMed
-
- Frazer KA, Ballinger DG, Cox DR, Hinds DA, Stuve LL, Gibbs RA, Belmont JW, Boudreau A, Hardenbol P, Leal SM, Pasternak S, Wheeler DA, Willis TD, Yu F, Yang H, Zeng C, Gao Y, Hu H, Hu W, Li C, Lin W, Liu S, Pan H, Tang X, Wang J, Wang W, Yu J, Zhang B, Zhang Q, Zhao H, et al. A second generation human haplotype map of over 3.1 million SNPs. Nature. 2007;449(7164):851–861. doi: 10.1038/nature06258. - DOI - PMC - PubMed
-
- The International HapMap ProjectNature 2003,426(6968):789–796. - PubMed
-
- Altshuler DM, Gibbs RA, Peltonen L, Dermitzakis E, Schaffner SF, Yu F, Bonnen PE, de Bakker PI, Deloukas P, Gabriel SB, Gwilliam R, Hunt S, Inouye M, Jia X, Palotie A, Parkin M, Whittaker P, Yu F, Chang K, Hawes A, Lewis LR, Ren Y, Wheeler D, Muzny DM, Barnes C, Darvishi K, Hurles M, Korn JM, Kristiansson K, International HapMap 3 Consortium1 et al. Integrating common and rare genetic variation in diverse human populations. Nature. 2010;467(7311):52–58. doi: 10.1038/nature09298. - DOI - PMC - PubMed
Publication types
MeSH terms
LinkOut - more resources
Full Text Sources
Other Literature Sources
