. 2014 May 5:14:119.
doi: 10.1186/1471-2229-14-119.

The genetic architecture of constitutive and induced trichome density in two new recombinant inbred line populations of Arabidopsis thaliana: phenotypic plasticity, epistasis, and bidirectional leaf damage response

Affiliations

The genetic architecture of constitutive and induced trichome density in two new recombinant inbred line populations of Arabidopsis thaliana: phenotypic plasticity, epistasis, and bidirectional leaf damage response

Rebecca H Bloomer et al. BMC Plant Biol. .

Abstract

Background: Herbivory imposes an important selective pressure on plants. In Arabidopsis thaliana leaf trichomes provide a key defense against insect herbivory; however, trichome production incurs a fitness cost in the absence of herbivory. Previous work on A. thaliana has shown an increase in trichome density in response to leaf damage, suggesting a mechanism by which the cost associated with constitutively high trichome density might be mitigated; however, the genetic basis of trichome density induction has not been studied.

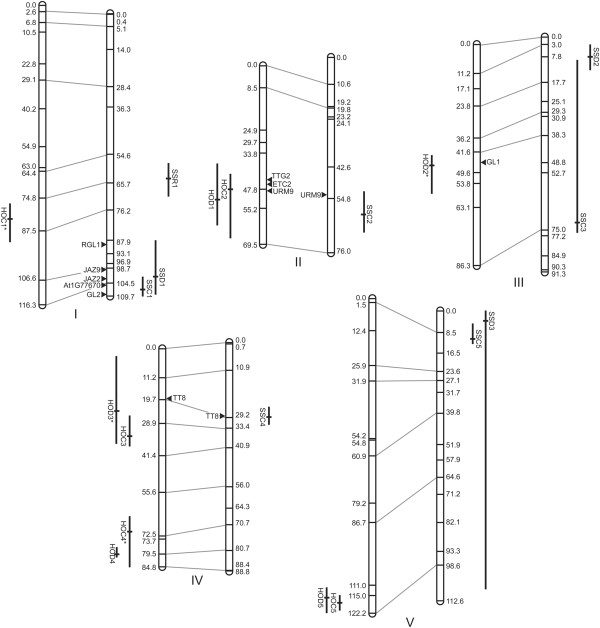
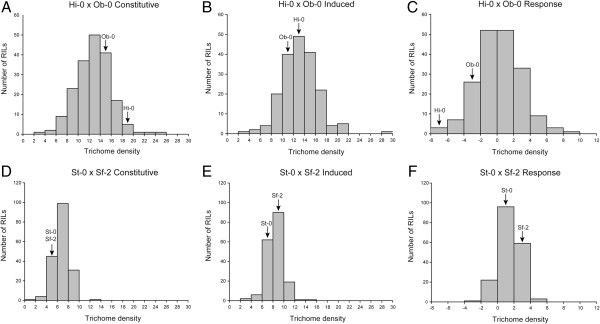
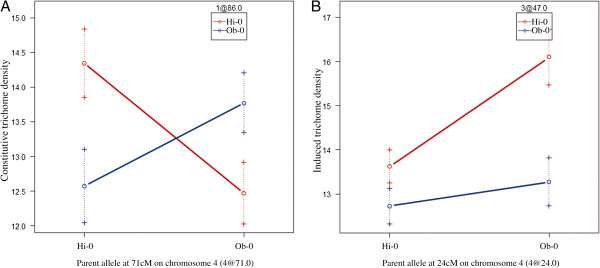
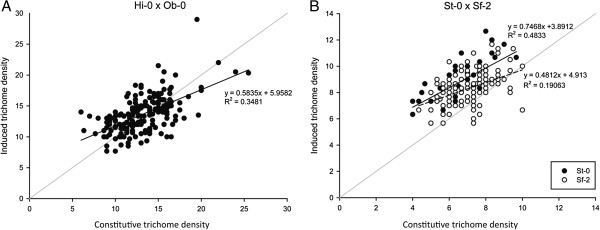
Results: Here, we describe the mapping of quantitative trait loci (QTL) for constitutive and damage induced trichome density in two new recombinant inbred line populations of A. thaliana; mapping for constitutive and induced trichome density also allowed for the investigation of damage response (plasticity) QTL. Both novel and previously identified QTL for constitutive trichome density and the first QTL for induced trichome density and response are identified. Interestingly, two of the four parental accessions and multiple RILs in each population exhibited lower trichome density following leaf damage, a response not previously described in A. thaliana. Importantly, a single QTL was mapped for the response phenotype and allelic variation at this locus appears to determine response trajectory in RILs. The data also show that epistatic interactions are a significant component of the genetic architecture of trichome density.

Conclusions: Together, our results provide further insights into the genetic architecture of constitutive trichome density and new insights into induced trichome density in A. thaliana specifically and to our understanding of the genetic underpinnings of natural variation generally.


Figures

Figure 1
Figure 1
Linkage maps and mapped QTL. Aligned linkage maps for the five A. thaliana chromosomes for the Hi-0 x Ob-0 (left) and St-0 x Sf-2 (right) RIL mapping populations, with marker positions shown in cM. The peak LOD positions for QTL identified for each of the three traits are indicated by short solid black horizontal bars; Bayes’ credible intervals are indicated by perpendicular bars. Interacting QTL are indicated with an *. QTL are labelled by population and trait as in Table 3: HOC = Hi-0 x Ob-0 Constitutive; HOD = Hi-0 x Ob-0 Damage induced; SSC = St-0 x Sf-2 Constitutive; SSD = St-0 x Sf-2 Damage induced; SSR = St-0 x Sf-2 Response to leaf damage. Positions and names of candidate genes are marked with a black triangle.
Figure 2
Figure 2
Distribution of constitutive and induced trichome densities and response to damage for the Hi-0 x Ob-0 (A-C) and St-0 x Sf-2 (D-F) RILs and population parents. Labelled arrows indicate the parental phenotypes’ positions in each distribution. Note that the Hi-0 and Ob-0 accessions and some proportion of RILs in both populations have negative responses to leaf damage.
Figure 3
Figure 3
Effectplots for epistatic interactions identified between pairs of QTL for the constitutive trichome density (A) and induced trichome density (B) phenotypes in the Hi-0 x Ob-0 mapping population. Each panel shows the mean trichome density phenotype (y axis) for the four possible allele combinations found at two interacting loci. The parental allele at one QTL is indicated on the x axis and the parental allele at the interacting QTL is indicated by the color of the plot points and lines. Panel A shows a large interaction effect for constitutive trichome density between loci on chromosome 1 at 86 cM (HOC1, here labelled 1@86) and on chromosome 4 at 71 cM (HOC4, here labelled 4@71); the highest trichome density is achieved by genotypes where the alleles from the same parent co-occur. Panel B shows an interaction for induced trichome density between loci on chromosome 3 at 47 cM (HOD2; 3@47) and chromosome 4 at 24 cM (HOD3; 4@24). Here, the effect of the chromosome 4 locus appears to be masked by the Ob-0 allele on chromosome 3.
Figure 4
Figure 4
Scatterplots for constitutive versus induced trichome density in the Hi-0 x Ob-0 (A) and St-0 x Sf-2 (B) RIL populations. Because a QTL was mapped for the response phenotype in the SS population, those data were partitioned according to the allele carried by individual RILs at the marker nearest the response QTL. The gray diagonal indicates a slope of 1 on each graph; any point above the line therefore reflects RILs with a positive response to leaf damage (i.e., they increase trichome density) and any point that lies beneath the line are negative responders, which reduce trichome density in response to leaf damage. Separate regression equations and R2 values are shown for the two SSR1 genotypes in the SS population; the regression equation for the entire SS population is y = 0.543x + 4.7466 with an R2 = 0.2406.

References

    1. Cyr H, Pace ML. Magnitude and patterns of herbivory in aquatic and terrestrial ecosystems. Nature. 1993;361(6408):148–150. doi: 10.1038/361148a0. - DOI
    1. Kivimaki M, Karkkainen K, Gaudeul M, Loe G, Agren J. Gene, phenotype and function: GLABROUS1 and resistance to herbivory in natural populations of Arabidopsis lyrata. Mol Ecol. 2007;16(2):453–462. doi: 10.1111/j.1365-294X.2007.03109.x. - DOI - PubMed
    1. Mauricio R. Costs of resistance to natural enemies in field populations of the annual plant Arabidopsis thaliana. Am Nat. 1998;151(1):20–28. doi: 10.1086/286099. - DOI - PubMed
    1. Mauricio R, Rausher MD. Experimental manipulation of putative selective agents provides evidence for the role of natural enemies in the evolution of plant defense. Evolution. 1997;51(5):1435–1444. doi: 10.2307/2411196. - DOI - PubMed
    1. Zust T, Joseph B, Shimizu KK, Kliebenstein DJ, Turnbull LA. Using knockout mutants to reveal the growth costs of defensive traits. Proc Biol Sci. 2011;278(1718):2598–2603. doi: 10.1098/rspb.2010.2475. - DOI - PMC - PubMed

Publication types