

Genome-wide expression profile of the response to spinal cord injury in Xenopus laevis reveals extensive differences between regenerative and non-regenerative stages
- PMID: 24885550
- PMCID: PMC4046850
- DOI: 10.1186/1749-8104-9-12
Genome-wide expression profile of the response to spinal cord injury in Xenopus laevis reveals extensive differences between regenerative and non-regenerative stages
Abstract
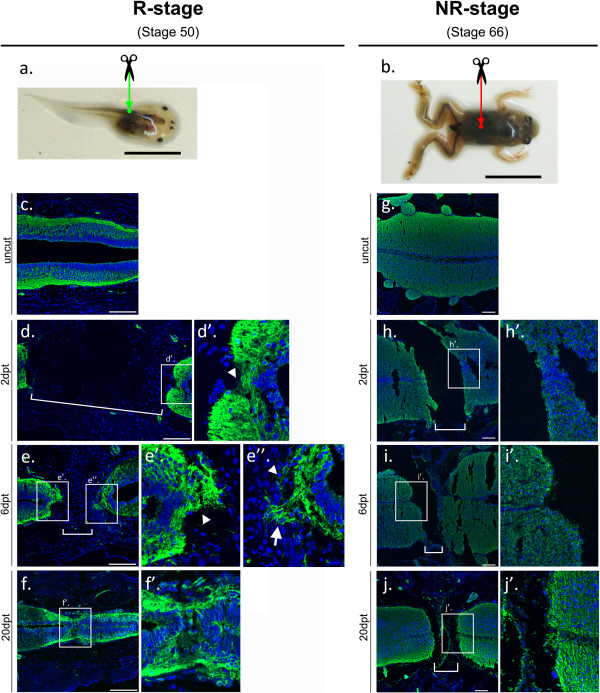
Background: Xenopus laevis has regenerative and non-regenerative stages. As a tadpole, it is fully capable of functional recovery after a spinal cord injury, while its juvenile form (froglet) loses this capability during metamorphosis. We envision that comparative studies between regenerative and non-regenerative stages in Xenopus could aid in understanding why spinal cord regeneration fails in human beings.
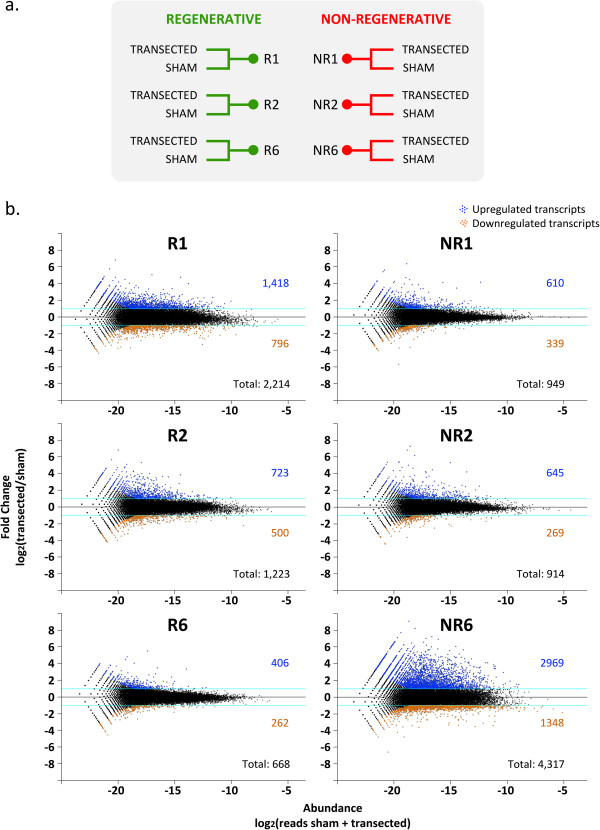
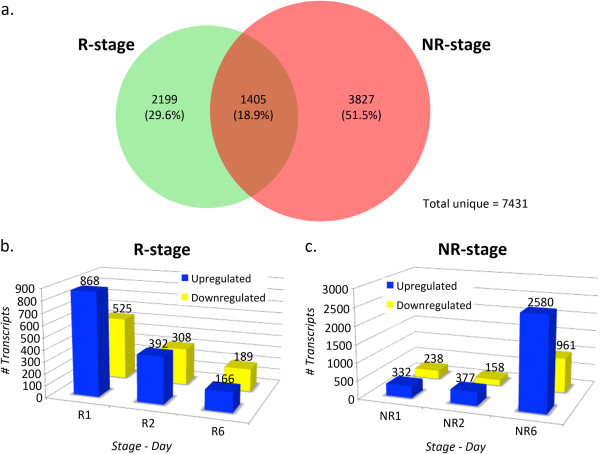
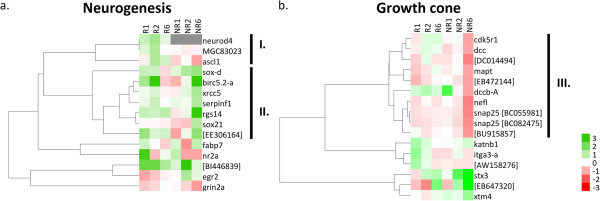
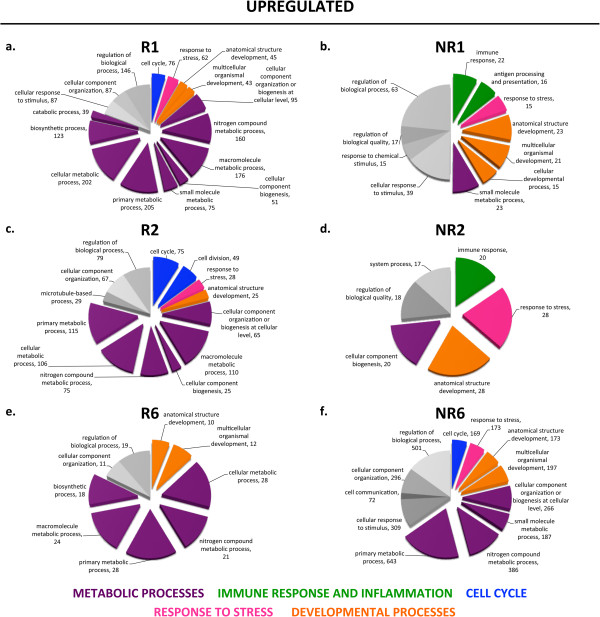
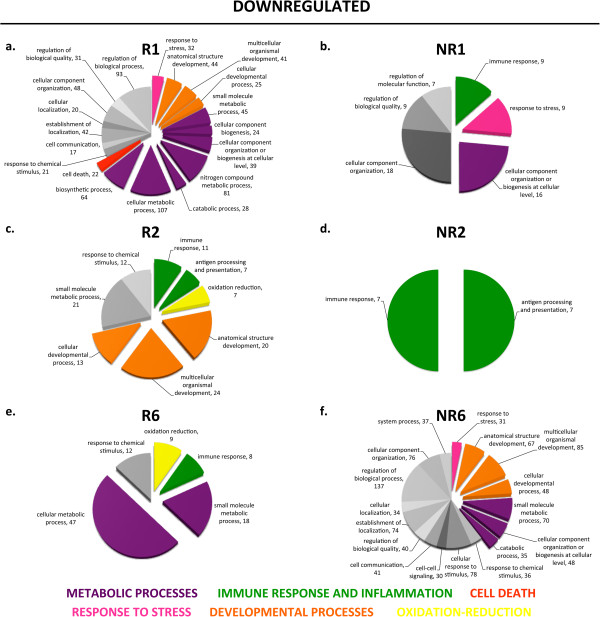
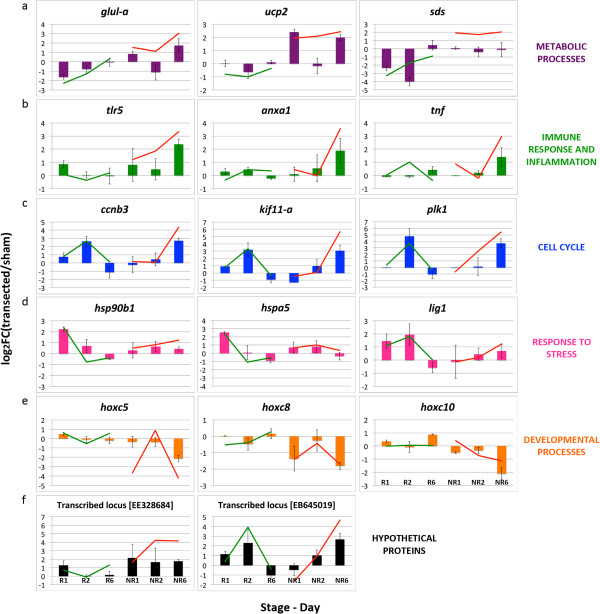
Results: To identify the mechanisms that allow the tadpole to regenerate and inhibit regeneration in the froglet, we obtained a transcriptome-wide profile of the response to spinal cord injury in Xenopus regenerative and non-regenerative stages. We found extensive transcriptome changes in regenerative tadpoles at 1 day after injury, while this was only observed by 6 days after injury in non-regenerative froglets. In addition, when comparing both stages, we found that they deployed a very different repertoire of transcripts, with more than 80% of them regulated in only one stage, including previously unannotated transcripts. This was supported by gene ontology enrichment analysis and validated by RT-qPCR, which showed that transcripts involved in metabolism, response to stress, cell cycle, development, immune response and inflammation, neurogenesis, and axonal regeneration were regulated differentially between regenerative and non-regenerative stages.
Conclusions: We identified differences in the timing of the transcriptional response and in the inventory of regulated transcripts and biological processes activated in response to spinal cord injury when comparing regenerative and non-regenerative stages. These genes and biological processes provide an entry point to understand why regeneration fails in mammals. Furthermore, our results introduce Xenopus laevis as a genetic model organism to study spinal cord regeneration.
Figures
Similar articles
-
Regeneration of Xenopus laevis spinal cord requires Sox2/3 expressing cells.Dev Biol. 2015 Dec 15;408(2):229-43. doi: 10.1016/j.ydbio.2015.03.009. Epub 2015 Mar 19. Dev Biol. 2015. PMID: 25797152 Free PMC article.
-
Cellular response to spinal cord injury in regenerative and non-regenerative stages in Xenopus laevis.Neural Dev. 2021 Feb 2;16(1):2. doi: 10.1186/s13064-021-00152-2. Neural Dev. 2021. PMID: 33526076 Free PMC article.
-
Spinal Cord Transection In Xenopus laevis Tadpoles.J Vis Exp. 2021 Dec 10;(178). doi: 10.3791/63276. J Vis Exp. 2021. PMID: 34958088
-
The African clawed frog Xenopus laevis: A model organism to study regeneration of the central nervous system.Neurosci Lett. 2017 Jun 23;652:82-93. doi: 10.1016/j.neulet.2016.09.054. Epub 2016 Sep 29. Neurosci Lett. 2017. PMID: 27693567 Review.
-
Xenopus laevis as a Model Organism for the Study of Spinal Cord Formation, Development, Function and Regeneration.Front Neural Circuits. 2017 Nov 23;11:90. doi: 10.3389/fncir.2017.00090. eCollection 2017. Front Neural Circuits. 2017. PMID: 29218002 Free PMC article. Review.
Cited by
-
E2F4 Promotes Neuronal Regeneration and Functional Recovery after Spinal Cord Injury in Zebrafish.Front Pharmacol. 2016 May 9;7:119. doi: 10.3389/fphar.2016.00119. eCollection 2016. Front Pharmacol. 2016. PMID: 27242526 Free PMC article.
-
Distinct Glycosylation Responses to Spinal Cord Injury in Regenerative and Nonregenerative Models.J Proteome Res. 2022 Jun 3;21(6):1449-1466. doi: 10.1021/acs.jproteome.2c00043. Epub 2022 May 4. J Proteome Res. 2022. PMID: 35506863 Free PMC article.
-
Quantitative Proteomics After Spinal Cord Injury (SCI) in a Regenerative and a Nonregenerative Stage in the Frog Xenopus laevis.Mol Cell Proteomics. 2018 Apr;17(4):592-606. doi: 10.1074/mcp.RA117.000215. Epub 2018 Jan 22. Mol Cell Proteomics. 2018. PMID: 29358338 Free PMC article.
-
Timing of neuronal plasticity in development and aging.Wiley Interdiscip Rev Dev Biol. 2018 Mar;7(2):10.1002/wdev.305. doi: 10.1002/wdev.305. Epub 2017 Nov 15. Wiley Interdiscip Rev Dev Biol. 2018. PMID: 29139210 Free PMC article. Review.
-
Marcks and Marcks-like 1 proteins promote spinal cord development and regeneration in Xenopus.Elife. 2024 Dec 12;13:e98277. doi: 10.7554/eLife.98277. Elife. 2024. PMID: 39665418 Free PMC article.
References
-
- Polezhaev LV. Loss and Restoration of Regenerative Capacity in Tissues and Organs of Animals. Cambridge, MA: Harvard University Press; 1972.
-
- Deuchar E. Regeneration of amputated limb-buds in early rat embryos. J Embryol Exp Morphol. 1976;35:345–354. - PubMed
-
- Becker RO. The bioelectric factors in amphibian-limb regeneration. J Bone Joint Surg Am. 1961;43-A:643–656. - PubMed
Publication types
MeSH terms
LinkOut - more resources
Full Text Sources
Other Literature Sources
Medical
Research Materials
