. 2014 May 30:12:43.
doi: 10.1186/1741-7007-12-43.

BMP2-induced chemotaxis requires PI3K p55γ/p110α-dependent phosphatidylinositol (3,4,5)-triphosphate production and LL5β recruitment at the cytocortex

Affiliations

BMP2-induced chemotaxis requires PI3K p55γ/p110α-dependent phosphatidylinositol (3,4,5)-triphosphate production and LL5β recruitment at the cytocortex

Christian Hiepen et al. BMC Biol. .

Abstract

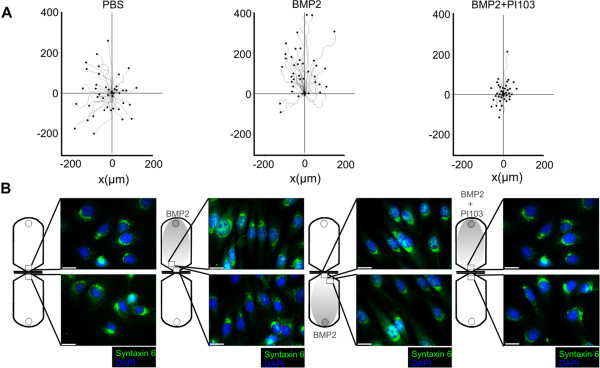
Background: BMP-induced chemotaxis of mesenchymal progenitors is fundamental for vertebrate development, disease and tissue repair. BMP2 induces Smad and non-Smad signalling. Whereas signal transduction via Smads lead to transcriptional responses, non-Smad signalling induces both, transcriptional and immediate/early non-transcriptional responses. However, the molecular mechanisms by which BMP2 facilitates planar cell polarity, cortical actin rearrangements, lamellipodia formation and chemotaxis of mesenchymal progenitors are poorly understood. Our aim was to uncover the molecular mechanism by which BMP2 facilitates chemotaxis via the BMP2-dependent activation of PI3K and spatiotemporal control of PIP3 production important for actin rearrangements at the mesenchymal cell cytocortex.

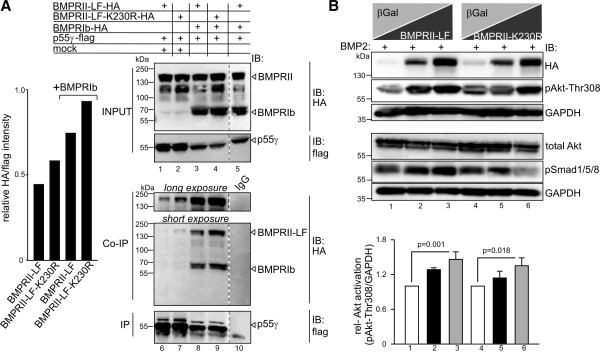
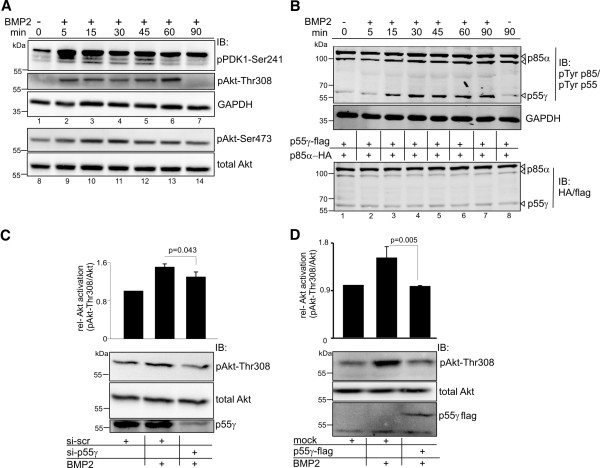
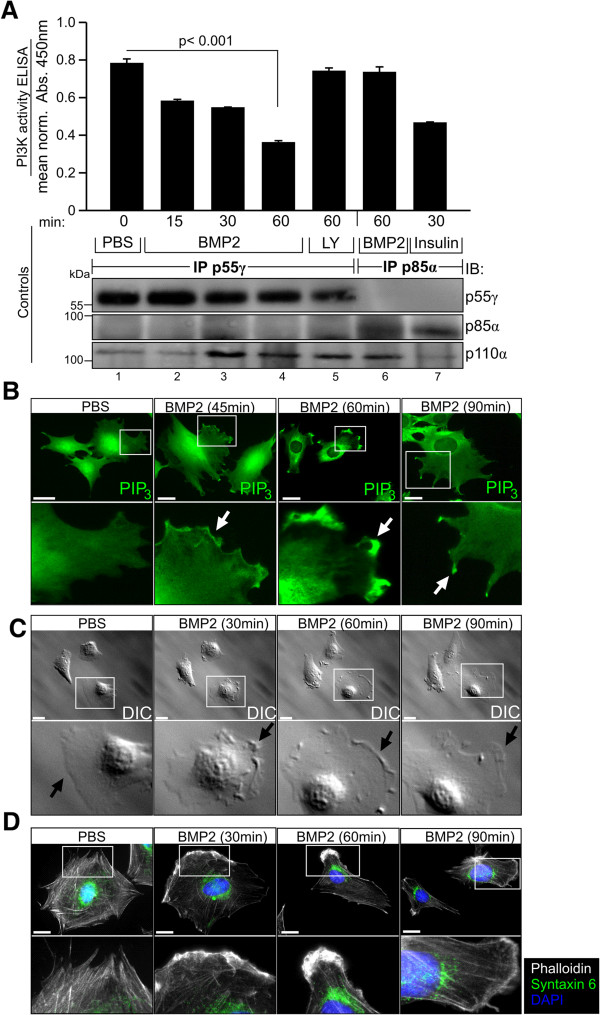
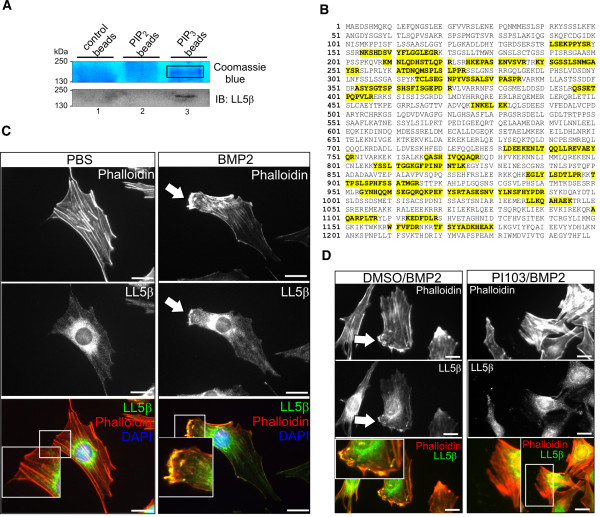
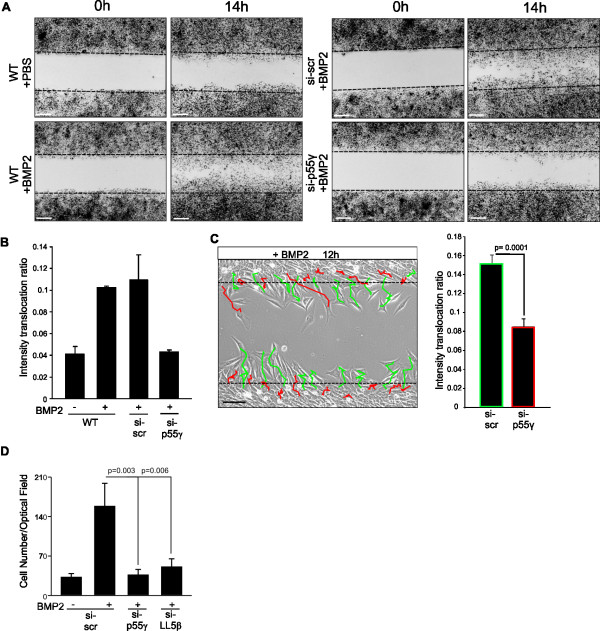
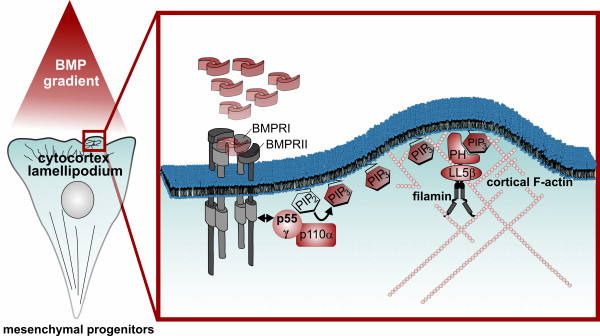
Results: We unveiled the molecular mechanism by which BMP2 induces non-Smad signalling by PI3K and the role of the second messenger PIP3 in BMP2-induced planar cell polarity, cortical actin reorganisation and lamellipodia formation. By using protein interaction studies, we identified the class Ia PI3K regulatory subunit p55γ to act as a specific and non-redundant binding partner for BMP receptor type II (BMPRII) in concert with the catalytic subunit p110α. We mapped the PI3K interaction to a region within the BMPRII kinase. Either BMP2 stimulation or increasing amounts of BMPRI facilitated p55γ association with BMPRII, but BMPRII kinase activity was not required for the interaction. We visualised BMP2-dependent PIP3 production via PI3K p55γ/p110α and were able to localise PIP3 to the leading edge of intact cells during the process of BMP2-induced planar cell polarity and actin dependent lamellipodia formation. Using mass spectrometry, we found the highly PIP3-sensitive PH-domain protein LL5β to act as a novel BMP2 effector in orchestrating cortical actin rearrangements. By use of live cell imaging we found that knock-down of p55γ or LL5β or pharmacological inhibition of PI3K impaired BMP2-induced migratory responses.

Conclusions: Our results provide evidence for an important contribution of the BMP2-PI3K (p55γ/p110α)- PIP3-LL5β signalling axis in mesenchymal progenitor cell chemotaxis. We demonstrate molecular insights into BMP2-induced PI3K signalling on the level of actin reorganisation at the leading edge cytocortex. These findings are important to better understand BMP2-induced cytoskeletal reorganisation and chemotaxis of mesenchymal progenitors in different physiological or pathophysiological contexts.


Figures

Figure 1
Figure 1
BMP2 induces chemotaxis of multipotent mesenchymal C2C12 mouse myoblasts. (A) Trajectories of multipotent mouse mesenchymal C2C12 cells migrating in a 2D chemotaxis chamber over period of 16 hours exposed to a linear BMP2 gradient compared to non-stimulated control or in the presence of the PI3K p110α selective inhibitor PI103 (8 nM). The gradient was produced by application of BMP2 to the upper reservoir. It was allowed to generate a linear concentration profile with a maximum concentration of approximately 10 nM reaching the cells on the edge of the observation area as described by the manufacturer. (B) Syntaxin 6 and DAPI stainings of C2C12 cells after BMP2-induced chemotaxis compared to non-stimulated control or PI103 [8 nM] pre-treatment. The location of the depicted cells within the chemotaxis chamber is indicated. Scale bar represents 20 μm. (2D) two dimensional; (BMP2) Bone Morphogenetic Protein 2; (PI3K) Phosphoinositide 3-kinase; (p110α) Class I PI3K catalytic subunit alpha; (DAPI) 4',6-diamidino-2-phenylindole.
Figure 2
Figure 2
PI3K regulatory subunit p55γ interacts with BMPRII and p110α. (A) p55γ-specific peptides obtained after GST-BMPRII-pull-down from C2C12 lysates [20] are shown in yellow. (B) Scheme depicting BMPRII and truncations, including all tyrosines (black lines) and the ones serving as putative p55γ-SH2 domain binding sites (*). Tyrosines identified by alignment with known SH2 binding peptides (*) and oriented peptide library technique (**). Lines indicate localisation of 24 intracellular tyrosines in BMPRII. On the right, lanes 1 to 8 show input controls (top) and co-immunoprecipitation of BMPRII-LF, -SF or TC3-8 with p55γ from transfected HEK293T cells. The expected molecular weights of BMPRII and truncations are marked by white arrowheads. (C) Co-immunoprecipitation of endogenous BMPRII-LF and -SF (black arrowheads) with endogenous p55γ, but not p85α upon stimulation with 10 nM BMP2 for indicated time. The depicted western blots are representative of three independent experiments. (D) Immunocytochemical staining of C2C12 cells displaying co-localisation of endogenous p55γ, but not p85α, with overexpressed HA-tagged BMPRII-LF. Enlarged region of interest depicts co-localisation of p55γ but not p85α (green) with HA-tagged BMPRII-LF (red) at the cell periphery. Scale bar: 10 μm. (E) Co-immunoprecipitation from C2C12 lysates of endogenous BMPRII and endogenous p110α upon BMP2 stimulation for indicated time. (F) BMP2-induced tyrosine phosphorylation of BMPRII-LF. HEK293T cells transfected with HA-tagged BMPRII-LF were treated with 10 nM BMP2 for indicated time and subjected to immunoprecipitation with anti-HA antibody. Input controls of HA-tagged BMPRII-LF and BMP2-induced Smad 1/5/8 phosphorylation kinetics are shown (upper two panels). Fourth panel indicates BMPRII tyrosine phosphorylation through incubation of α-HA precipitates with pan anti-pTyr antibody. Dotted lines in F and B indicate deletion of non-relevant lanes. (See also Additional file 1: Figure S1C). (ECD) extracellular domain; (KD) kinase domain; (LF) long form; (SF) short form; (TC) truncation; (IgG) immunoglobulin G.
Figure 3
Figure 3
BMPRII-kinase activity is dispensable but BMPRI enhances the p55γ interaction with BMPRII. (A) Co-immunoprecipitation of HA-tagged BMPRII-LF or kinase-dead BMPRII-K230R-HA with flag-tagged p55γ in the presence or absence of BMPRIb-HA from transiently transfected HEK293T cells. Left panel depicts quantification of co-immunoprecipitated BMPRII relative to the amount of flag-tag mediated precipitation of p55γ. Upper panel shows input controls for BMPRII-HA, BMPRIb-HA and p55γ-flag. Lower panel depicts co-immunoprecipitation of BMPRII-HA with blots taken with long (upper lanes) and short (lower lanes) exposure times. White arrowheads indicate the migration heights of BMPRII, BMPRIb and p55γ. Dotted lines indicate deletion of non-relevant lanes from the same blot. (B) Activation of PI3K signalling by transient expression of BMPRII and BMPRII-K230R. Upper panel shows the effect of increasing amounts of BMPRII-LF or BMPRII-K230R transfected cells against β-galactosidase (β-gal) on the activation of phospho-Akt Thr308 in HEK293T cells. Experiments were carried out in the presence of 10 nM BMP2, which was added 60 minutes prior to cell lysis. Note the dominant negative effect of BMPRII-LF-K230R on pSmad1/5/8 but not phospho-Akt Thr308. Lower panel shows quantification of phospho-Akt Thr308 intensities relative to GAPDH. Error bars represent standard deviation from three independent experiments. P-values from one-way analysis of variance with post-hoc Bonferroni-test are indicated. (See also Additional file 2: Figure S2.)
Figure 4
Figure 4
BMP2-induced PI3K signalling is specifically mediated via p55γ. (A) Phospho-kinetics of PI3K effector proteins in C2C12 upon stimulation with 10 nM BMP2 for the indicated time. Phosphorylation of PDK1 (Ser241), Akt (Thr308) and Akt (Ser473) was analysed. (B) BMP2-dependent tyrosine phosphorylation at the inter-SH2 domain of PI3K regulatory subunits p55γ and p85α. HEK293T cells were transfected with equal amounts of p55γ-flag and p85α-HA and stimulated with 10 nM BMP2 for the indicated time. Upper panel depicts BMP2-dependent phosphorylation of conserved Tyr458 of p85α (see arrowheads, double band at approximately 100 kDa) corresponding to Tyr199 of p55γ (see arrowhead at approximately 55 kDa). The detected signals migrated accordingly to the signals of p85α-HA and p55γ-flag in the expression control (arrowheads, lower panel). (C) Knock-down of p55γ reduces BMP2-induced Akt-Thr308 phosphorylation of C2C12 cells upon 60 minutes’ stimulation with BMP2. The relative phospho-Akt-Thr308 to GAPDH levels were determined. (D) Overexpression of p55γ-flag in C2C12 cells reduces BMP2-induced Akt-Thr308 phosphorylation upon 60 minutes’ stimulation with BMP2. The relative phospho-Akt-Thr308 to GAPDH levels were determined. For experiments C and D: error bars represent standard deviation from three independent experiments. P-values from one-way analysis of variance with post-hoc Bonferroni-test are indicated. (See also Additional file 4: Figure S4.)
Figure 5
Figure 5
BMP2-induced PIP3 production is p55γ-dependent and localises to cortical actin during lamellipodia formation. (A) BMP2-dependent PIP3 production as detected by PI3K activity ELISA (upper panel). C2C12 cells were stimulated with respective ligands and inhibitors for the indicated times and lysates were subjected to pull-down of endogenous p55γ or p85α as shown. Precipitates were subjected to an in vitro kinase reaction and competitive ELISA was used to detect the amount of PIP3 produced by BMP2-induced PI3K activity. Low absorbance at 450 nm indicates high levels of PIP3. To prove the presence of catalytic p110α in PI3K regulatory subunit pull-down, bead lysates of all three assays were pooled and subjected to detection of p55γ, p85α and p110α protein respectively (lower panel). Error bars represent standard deviation from three independent experiments. (B) Immunocytochemical detection of PIP3 in BMP2 (10 nM) stimulated C2C12 cells by use of PIP3-specific antibody. The cortical region of PIP3 accumulation is indicated by the white arrow. (C) Differential interference contrast (DIC) microscopy of membrane ruffles at dorsal (white arrow) regions of the leading edge of C2C12 cells stimulated with 10 nM BMP2. In B and C, the lower boxes depict magnifications of the regions of interest indicated by white squares (upper boxes). Scale bars represent 20 μm. (D) Phalloidin and Synatxin 6 staining indicating trans-Golgi position facing the cortical actin-rich leading edge of C2C12 cells stimulated with 10 nM BMP2 for the indicated time. Scale bars represent 10 μm. (See also Additional file 5: Figure S5).
Figure 6
Figure 6
The PIP3-binding protein LL5β localises to BMP2-induced cortical actin-rich lamellipodia. (A) Upper panel shows colloidal Coomassie Blue staining of protein precipitates gained by precipitation of PIP2-, PIP3-coated and control beads from C2C12 cell lysates. Lower panel shows LL5β detection (approximately 160 kDa) by western blot. LL5β binds to PIP3 (lane 3) but not PIP2 or control beads (lanes 1 and 2). (B) LL5β-specific peptides (marked in yellow) as identified by mass spectrometry upon precipitation of PIP3-coated beads from C2C12 cell lysates. (C) Immunocytochemical stainings of endogenous LL5β and actin in C2C12 cells upon 45 minutes’ stimulation with 10 nM BMP2. Arrow indicates co-localisation of LL5β with cortical actin in BMP2-induced cell protrusions at the C2C12 cell leading edge (magnified region of interest). (D) PI103 pre-treatment blocks BMP2-induced co-localisation of LL5β with cortical actin. C2C12 cells were stimulated with 10 nM BMP2 for 45 minutes in the presence of DMSO or 8 nM PI103 respectively. The magnified region of interest depicts the co-localisation of LL5β with cortical actin. Scale bars represent 20 μm.
Figure 7
Figure 7
BMP2-induced PI3K signalling is important for directional cell migration. (A) C2C12 cell wound closure upon stimulation with 10 nM BMP2 for 14 hours compared to unstimulated control. Lipophilic carbocyanine-dye labelled cells (DiO) are presented in black pseudo-colour. Scale bar represents 200 μm. Left panel, effect of p55γ knock-down (si-p55γ) on C2C12 cell wound closure compared to scrambled transfected (si-scr) control. (B) Bar diagram depicting the intensity translocation values for three independent biological replicates for experiments shown in A using a selective mask filter (for detailed description see Methods and Additional file 7). Error bars represent standard deviation from three independent experiments. P-values from one-way analysis of variance with post-hoc Bonferroni-test are indicated. (C) Trajectories visualising the migration of p55γ knock-down (red) and scrambled control (green) C2C12 cells during BMP2-induced wound closure over a period of 12 hours. Scale bar represents 100 μm. Left panel, equal amounts of si-p55γ (red) and si-scr (green) transfected cells were labelled with DiI or DiO respectively prior to mixing and seeding. Bar diagram (right panel) summarises the intensity translocation ratios of p55γ knock-down (red) compared to scrambled control (green) C2C12 cells of 19 replicates analysed with P <0.005 considered statistically significant. (D) Transwell assay of C2C12 cells, transfected with either si-p55γ or si-LL5β compared to si-scr-transfected C2C12 cells. Cells migrated through an 8 μm porous filter upon stimulation with 10 nM BMP2 for 6 hours in the presence of 0.2% fetal calf serum. The number of cells migrated through the porous filter was counted. Bar diagram represents cell number counts per optical field. Error bars represent standard deviation from three independent experiments. P-values from one-way analysis of variance with post-hoc Bonferroni test are indicated.
Figure 8
Figure 8
Scheme depicting BMP2-induced PI3K signalling via p55γ/p110α and cortical actin rearrangements via PIP3-LL5β filamins in mesenchymal progenitor cells. Gradients of BMP2 activate the BMP receptor complex and facilitate the association of BMPRII to regulatory subunit p55γ coupled to class Ia catalytic subunit p110α. The recruitment and activation of PI3K generates the membrane-bound second messenger PIP3 at the leading edge of cells that are about to establish PCP. PIP3 recruits the PH-domain protein LL5β. LL5β co-recruits and tethers the actin crosslinker filamin to the leading edge, where it promotes actin polymerisation, crosslinking and subsequent initiation of lamellipodia formation, extension and protrusion. BMP2, bone morphogenetic protein 2; BMPRI/II, bone morphogenetic protein receptor type I/II; pSmad1, phospho-Smad1; p55γ, PI3K regulatory subunit p55 gamma; p110α, p110 catalytic subunit p110 alpha; PIP2, phosphatidylinositol (4,5)-bisphosphate; PIP3, phosphatidylinositol (3,4,5)-triphosphate; LL5β, pleckstrin homology-like domain family B member 2; PH, pleckstrin homology domain; F-actin, filamentous actin.

Similar articles

Cited by

References

    1. Ruschke K, Hiepen C, Becker J, Knaus P. BMPs are mediators in tissue crosstalk of the regenerating musculoskeletal system. Cell Tissue Res. 2012;12:521–544. - PubMed
    1. Correia AC, Costa M, Moraes F, Bom J, Novoa A, Mallo M. Bmp2 is required for migration but not for induction of neural crest cells in the mouse. Dev Dyn. 2007;12:2493–2501. - PubMed
    1. Fiedler J, Roderer G, Gunther KP, Brenner RE. BMP-2, BMP-4, and PDGF-bb stimulate chemotactic migration of primary human mesenchymal progenitor cells. J Cell Biochem. 2002;12:305–312. - PubMed
    1. Finkenzeller G, Hager S, Stark GB. Effects of bone morphogenetic protein 2 on human umbilical vein endothelial cells. Microvasc Res. 2012;12:81–85. - PubMed
    1. Mishima Y, Lotz M. Chemotaxis of human articular chondrocytes and mesenchymal stem cells. J Orthop Res. 2008;12:1407–1412. - PubMed

Publication types

MeSH terms

LinkOut - more resources