. 2014 May 15;15(1):374.
doi: 10.1186/1471-2164-15-374.

Nucleomorph and plastid genome sequences of the chlorarachniophyte Lotharella oceanica: convergent reductive evolution and frequent recombination in nucleomorph-bearing algae

Affiliations

Nucleomorph and plastid genome sequences of the chlorarachniophyte Lotharella oceanica: convergent reductive evolution and frequent recombination in nucleomorph-bearing algae

Goro Tanifuji et al. BMC Genomics. .

Abstract

Background: Nucleomorphs are residual nuclei derived from eukaryotic endosymbionts in chlorarachniophyte and cryptophyte algae. The endosymbionts that gave rise to nucleomorphs and plastids in these two algal groups were green and red algae, respectively. Despite their independent origin, the chlorarachniophyte and cryptophyte nucleomorph genomes share similar genomic features such as extreme size reduction and a three-chromosome architecture. This suggests that similar reductive evolutionary forces have acted to shape the nucleomorph genomes in the two groups. Thus far, however, only a single chlorarachniophyte nucleomorph and plastid genome has been sequenced, making broad evolutionary inferences within the chlorarachniophytes and between chlorarachniophytes and cryptophytes difficult. We have sequenced the nucleomorph and plastid genomes of the chlorarachniophyte Lotharella oceanica in order to gain insight into nucleomorph and plastid genome diversity and evolution.

Results: The L. oceanica nucleomorph genome was found to consist of three linear chromosomes totaling ~610 kilobase pairs (kbp), much larger than the 373 kbp nucleomorph genome of the model chlorarachniophyte Bigelowiella natans. The L. oceanica plastid genome is 71 kbp in size, similar to that of B. natans. Unexpectedly long (~35 kbp) sub-telomeric repeat regions were identified in the L. oceanica nucleomorph genome; internal multi-copy regions were also detected. Gene content analyses revealed that nucleomorph house-keeping genes and spliceosomal intron positions are well conserved between the L. oceanica and B. natans nucleomorph genomes. More broadly, gene retention patterns were found to be similar between nucleomorph genomes in chlorarachniophytes and cryptophytes. Chlorarachniophyte plastid genomes showed near identical protein coding gene complements as well as a high level of synteny.

Conclusions: We have provided insight into the process of nucleomorph genome evolution by elucidating the fine-scale dynamics of sub-telomeric repeat regions. Homologous recombination at the chromosome ends appears to be frequent, serving to expand and contract nucleomorph genome size. The main factor influencing nucleomorph genome size variation between different chlorarachniophyte species appears to be expansion-contraction of these telomere-associated repeats rather than changes in the number of unique protein coding genes. The dynamic nature of chlorarachniophyte nucleomorph genomes lies in stark contrast to their plastid genomes, which appear to be highly stable in terms of gene content and synteny.


Figures
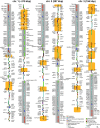
Figure 1
Figure 1
Physical map of the Lotharella oceanica nucleomorph genome. The genome is ~610 kbp in size with three chromosomes, shown artificially broken at their midpoint. Annotated genes are colored according to the functional categories shown in the lower right. The exact number of tandem repeats containing the ClpC and tfIIa-gamma genes on chromosome I is not known but was estimated to be at least five. Orange boxes indicate regions syntenic with the Bigelowiella natans nucleomorph genome (see text). Gray boxes show multi-copy regions. Genes mapped on the left side of each chromosome are transcribed bottom to top and those on the right, top to bottom.
Figure 2
Figure 2
Circular physical map of the plastid genome of Lotharella oceanica. The 70,997 bp genome contains inverted rRNA operons, 60 predicted protein genes, and 28 tRNA genes. Genes shown on the outside of the circle are transcribed clockwise. Annotated genes are colored according to the functional categories shown in the center.
Figure 3
Figure 3
G + C content and gene expression in the Lotharella oceanica nucleomorph genome. Gray boxes indicate gene expression levels corresponding to RNA-Seq coverage depth of each gene. Red lines show the G + C levels on the chromosomes, which were captured from Artemis genome annotation software with the default setting. The black boxes under the graph indicate multicopy regions.
Figure 4
Figure 4
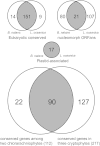
Comparison of nucleomorph gene content within and between chlorarachniophyte and cryptophyte algae. The Venn diagrams show the number of shared and / or unique genes in three categories: eukaryotic conserved (upper left), nucleomorph ORFans (upper right), and plastid-associated genes in the two chlorarachniophyte nucleomorph genomes (middle center), and core nucleomorph genes (excluding spliceosomal machinery genes and plastid-associated genes) in chlorarachniophytes and cryptophytes (bottom).
Figure 5
Figure 5
Introns in the Lotharella oceanica and Bigelowiella natans nucleomorph genomes . A) Intron size distribution for L. oceanica (left) and B. natans (right). The numbers above each bar show the actual numbers of introns in each size category. B) Intron comparison of two chlorarachniophyte nucleomorph genomes. The Venn diagram shows the number of shared and/ or unique comparable spliceosomal introns in the two genomes. Comparable spliceosomal introns were selected using the criteria proposed by Roy and Penny [30].
Figure 6
Figure 6
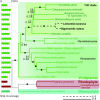
Phylogenetic tree inferred from a concatenated set of 99 proteins (52 nucleomorph-/nucleus-encoded proteins and 47 plastid proteins) using PhyloBayes with the CAT + GTR + gamma model (4 rate categories). Support values below the lines indicate Bayesian posterior probabilities, while the upper numbers are bootstrap support values based on RAxML. Black circles indicate branches supported with 100% bootstrap values and posterior probabilities of 1.0. Nodes where support values are less than 50% are shown with an asterisk (*). Scale bars shown by solid and broken lines indicate inferred number of amino acid substitutions per site. The fraction of amino acid sites present in the data matrix (site coverage) is shown on the left.

Similar articles

Cited by

References

    1. Dolezal P, Likic V, Tachezy J, Lithgow T. Evolution of the molecular machines for protein import into mitochondria. Science. 2006;313:314–318. doi: 10.1126/science.1127895. - DOI - PubMed
    1. Gray MW, Burger G, Lang BF. Mitochondrial evolution. Science. 1999;283:1476–1481. doi: 10.1126/science.283.5407.1476. - DOI - PubMed
    1. Gould SB, Waller RR, McFadden GI. Plastid evolution. Annu Rev Plant Biol. 2008;59:491–517. doi: 10.1146/annurev.arplant.59.032607.092915. - DOI - PubMed
    1. Reyes-Prieto A, Weber APM, Bhattacharya D. The origin and establishment of the plastid in algae and plants. Annu Rev Genet. 2007;41:147–168. doi: 10.1146/annurev.genet.41.110306.130134. - DOI - PubMed
    1. Martin W, Herrmann RG. Gene transfer from organelles to the nucleus: How much, what happens, and why? Plant Physiol. 1998;118:9–17. doi: 10.1104/pp.118.1.9. - DOI - PMC - PubMed

Publication types

Associated data

LinkOut - more resources