. 2014 Jun 1:12:156.
doi: 10.1186/1479-5876-12-156.

Quantification of tumour budding, lymphatic vessel density and invasion through image analysis in colorectal cancer

Affiliations

Quantification of tumour budding, lymphatic vessel density and invasion through image analysis in colorectal cancer

Peter D Caie et al. J Transl Med. .

Abstract

Background: Tumour budding (TB), lymphatic vessel density (LVD) and lymphatic vessel invasion (LVI) have shown promise as prognostic factors in colorectal cancer (CRC) but reproducibility using conventional histopathology is challenging. We demonstrate image analysis methodology to quantify the histopathological features which could permit standardisation across institutes and aid risk stratification of Dukes B patients.

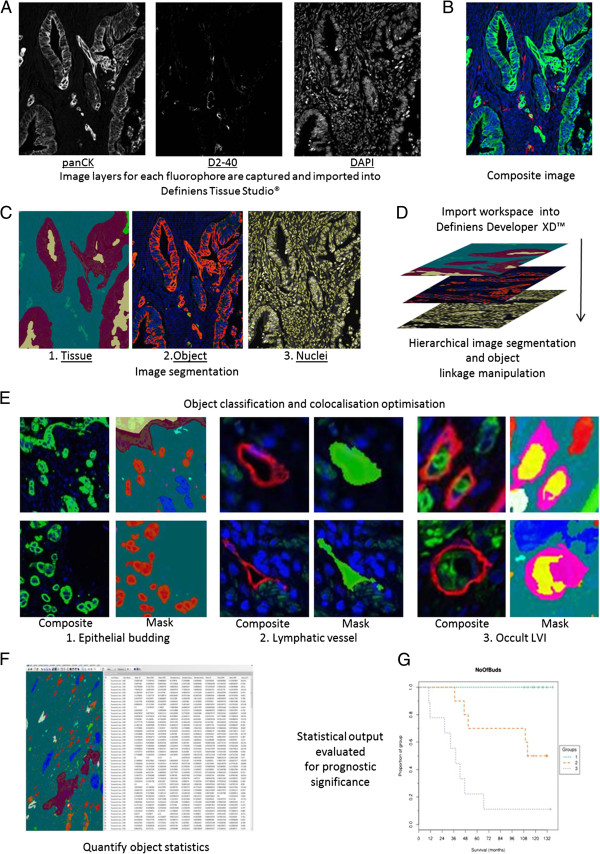
Methods: Multiplexed immunofluorescence of pan-cytokeratin, D2-40 and DAPI identified epithelium, lymphatic vessels and all nuclei respectively in tissue sections from 50 patients diagnosed with Dukes A (n = 13), Dukes B (n = 29) and Dukes C (n = 8) CRC. An image analysis algorithm was developed and performed, on digitised images of the CRC tissue sections, to quantify TB, LVD, and LVI at the invasive front.

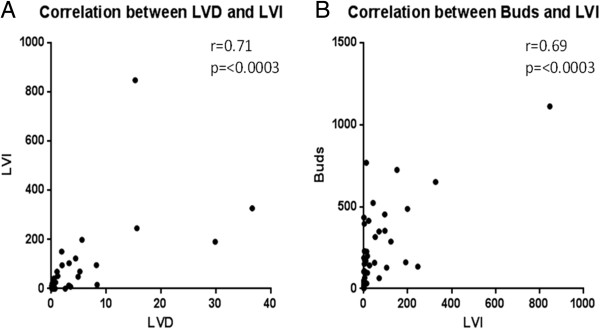
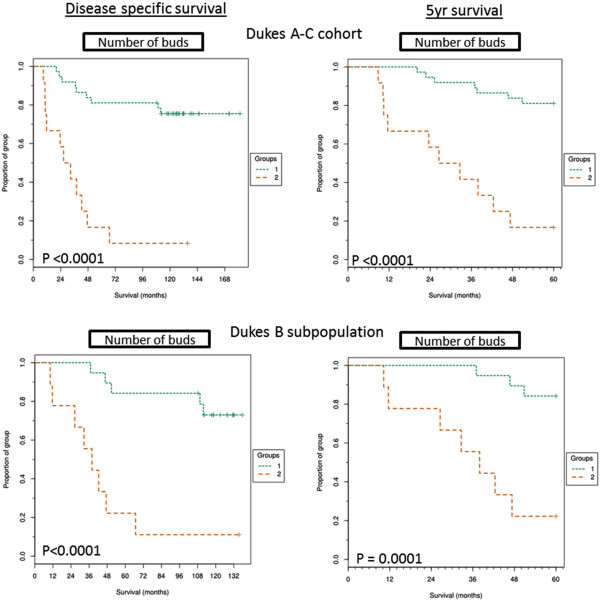
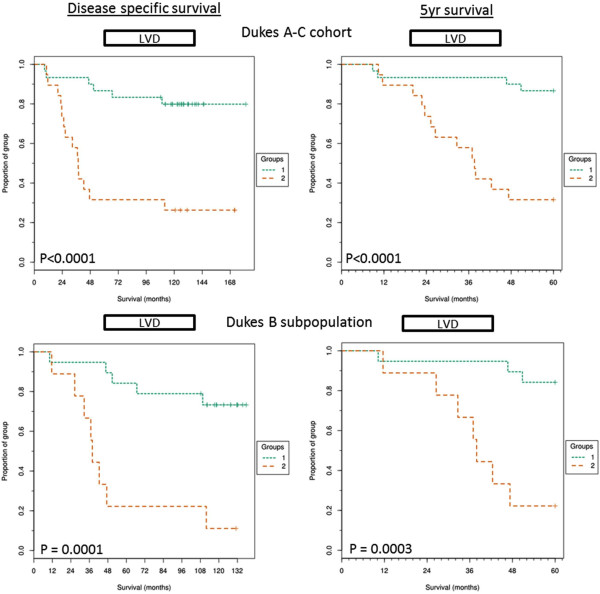
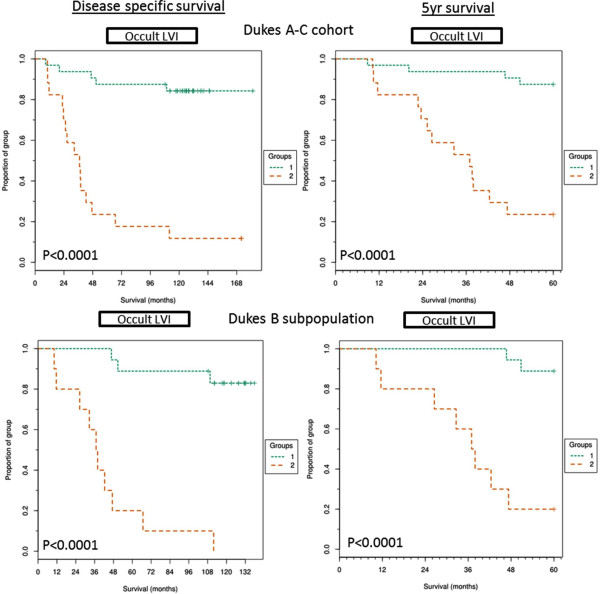
Results: TB (HR =5.7; 95% CI, 2.38-13.8), LVD (HR =5.1; 95% CI, 2.04-12.99) and LVI (HR =9.9; 95% CI, 3.57-27.98) were successfully quantified through image analysis and all were shown to be significantly associated with poor survival, in univariate analyses. LVI (HR =6.08; 95% CI, 1.17-31.41) is an independent prognostic factor within the study and was correlated to both TB (Pearson r =0.71, p <0.0003) and LVD (Pearson r =0.69, p <0.0003).

Conclusion: We demonstrate methodology through image analysis which can standardise the quantification of TB, LVD and LVI from a single tissue section while decreasing observer variability. We suggest this technology is capable of stratifying a high risk Dukes B CRC subpopulation and we show the three histopathological features to be of prognostic significance.


Figures

Figure 1
Figure 1
Image analysis pipeline for histopathological feature quantification. A) Images for each wavelength are acquired and digitised prior to being imported into Definiens Tissue Studio®. B) A Composite image is created within the software; green (panCK), red (D2-40) & blue (DAPI). C) 1. Tissue level segmentation: Tissue is segmented prior to image based machine learning through Definiens Composer technology; blue (stroma), maroon (tumour), mustard (lumen/necrosis). C) 2. Object level segmentation: PanCK (Marker 1: red) and D2-40 (Marker 2: green) staining above set thresholds are segmented. C) 3. Nucleus level segmentation: DAPI channel is used to segment nuclei (yellow). D) Analysis workspace is imported into Defineins Developer™ for hierarchical layer manipulation and false positive marker identification. E) Object classification and colocalisation optimisation. 1. Markers 1 in stroma (blue) classified as tumour bud (red; 1–5 nuclei), bud with debris nucleus (light blue; debris nuclei associated), irrelevant marker (pink; no associated nucleus) and large bud (dark blue; >5 nuclei). 2. Lymphatic vessels and lumen are segmented and classified (green). 3. Colocalisation of tumour buds and lymphatic vessels are classified (yellow; LVI), (pink; vessel border to LVI). F. Relevant objects are quantified and exported from the software; Figure 1F is representative of example data acquired from image object analysis. G. Prognostic results are calculated from the exported analysis data which was acquired from image object quantification.
Figure 2
Figure 2
Correlation of histopathological features. Continuous data plotted through Pearson’s Correlation (r value) after Bonferoni correction to assess correlation between A) LVI and LVD and B) LVI and TB. Significance shown by P value.
Figure 3
Figure 3
Kaplan-Meier curves for tumour budding. Kaplan-Meier curves showing full follow up disease specific and 5 year disease specific survival of above cut-off TB group (>287 buds, group 2) and below cut-off TB group (<287 buds, group 1) within the full Dukes A-C cohort and the Dukes B subpopulation and across disease specific survival or 5 year survival. Significance shown by P value calculated from mantel-cox analysis and FDR corrected.
Figure 4
Figure 4
Kaplan-Meier curves for Lymphatic vessel density. Kaplan-Meier curves showing full follow up disease specific and 5 year disease specific survival of above cut-off LVD group (>0.7% vessels of total stroma area, group 2) and below cut-off LVD group (<0.7 vessel% of stroma area, group 1) within the full Dukes A-C cohort and the Dukes B subpopulation and across disease specific survival or 5 year survival. Significance shown by P value calculated from mantel-cox analysis and FDR corrected.
Figure 5
Figure 5
Kaplan-Meier curves for lymphatic vessel invasion. Kaplan-Meier curves showing full follow up disease specific and 5 year disease specific survival of above cut-off LVI group (>16 LVI events, group 2) and below cut-off LVD group (<16 LVI events, group 1) within the full Dukes A-C cohort or the Dukes B subpopulation and across disease specific survival or 5 year survival. Significance shown by P value calculated from mantel-cox analysis and FDR corrected.

Similar articles

Cited by

References

    1. Standards and Datasets for Reporting Cancers Dataset for colorectal cancer. 2. 2007. [ http://www.rcpath.org/Resources/RCPath/Migrated%20Resources/Documents/G/...]
    1. Lan YT, Yang SH, Chang SC, Liang WY, Li AF, Wang HS, Jiang JK, Chen WS, Lin TC, Lin JK. Analysis of the seventh edition of American Joint Committee on colon cancer staging. Int J Colorectal Dis. 2012;27:657–663. - PubMed
    1. Poston GJ, Tait D, O'Connell S, Bennett A, Berendse S. Diagnosis and management of colorectal cancer: summary of NICE guidance. BMJ. 2011;343:d6751. - PubMed
    1. O'Connell JB, Maggard MA, Ko CY. Colon cancer survival rates with the new American Joint Committee on Cancer sixth edition staging. J Natl Cancer Inst. 2004;96:1420–1425. - PubMed
    1. Huh JW, Lee JH, Kim HR, Kim YJ. Prognostic significance of lymphovascular or perineural invasion in patients with locally advanced colorectal cancer. Am J Surg. 2013;206:758–763. - PubMed

Publication types