. 2014 May 5:14:120.
doi: 10.1186/1471-2229-14-120.

Defining the full tomato NB-LRR resistance gene repertoire using genomic and cDNA RenSeq

Affiliations

Defining the full tomato NB-LRR resistance gene repertoire using genomic and cDNA RenSeq

Giuseppe Andolfo et al. BMC Plant Biol. .

Abstract

Background: The availability of draft crop plant genomes allows the prediction of the full complement of genes that encode NB-LRR resistance gene homologs, enabling a more targeted breeding for disease resistance. Recently, we developed the RenSeq method to reannotate the full NB-LRR gene complement in potato and to identify novel sequences that were not picked up by the automated gene prediction software. Here, we established RenSeq on the reference genome of tomato (Solanum lycopersicum) Heinz 1706, using 260 previously identified NB-LRR genes in an updated Solanaceae RenSeq bait library.

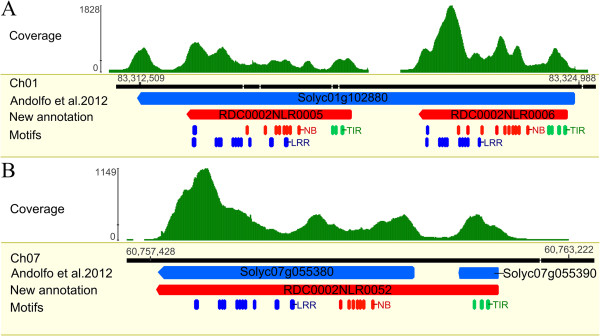
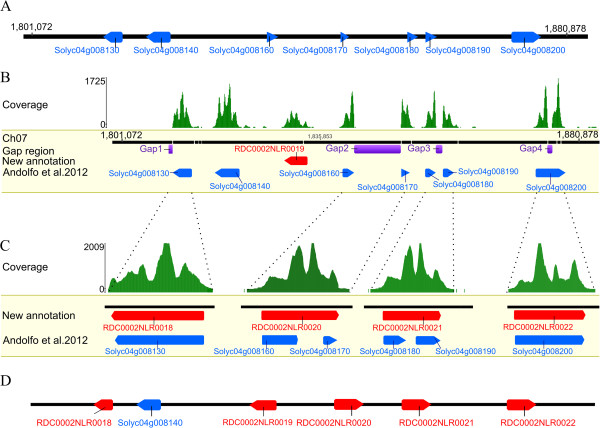
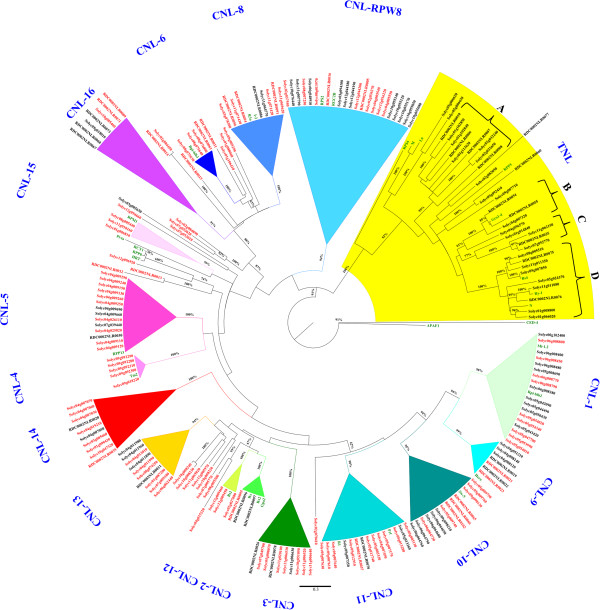
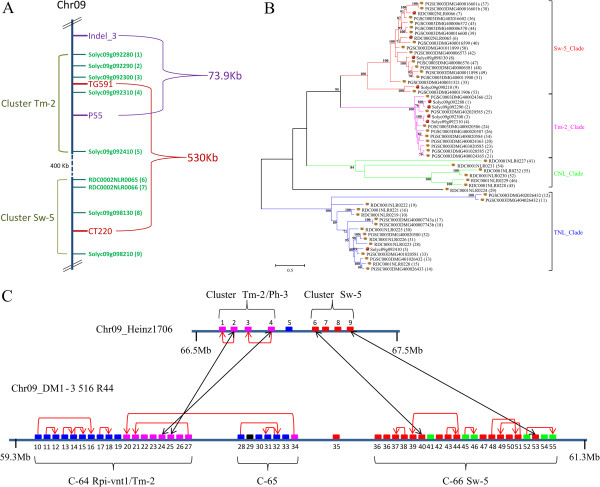
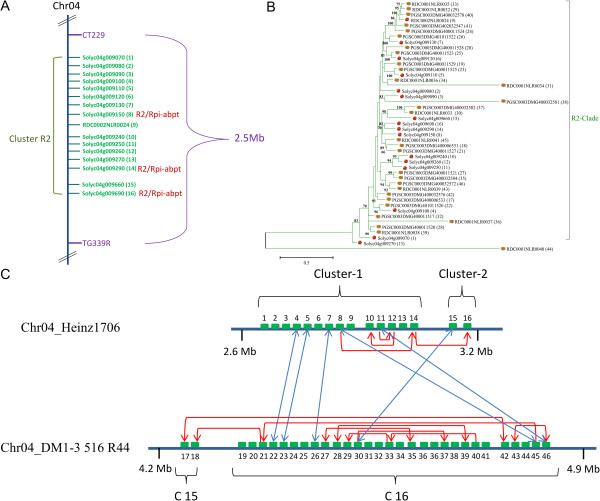
Result: Using 250-bp MiSeq reads after RenSeq on genomic DNA of Heinz 1706, we identified 105 novel NB-LRR sequences. Reannotation included the splitting of gene models, combination of partial genes to a longer sequence and closing of assembly gaps. Within the draft S. pimpinellifolium LA1589 genome, RenSeq enabled the annotation of 355 NB-LRR genes. The majority of these are however fragmented, with 5'- and 3'-end located on the edges of separate contigs. Phylogenetic analyses show a high conservation of all NB-LRR classes between Heinz 1706, LA1589 and the potato clone DM, suggesting that all sub-families were already present in the last common ancestor. A phylogenetic comparison to the Arabidopsis thaliana NB-LRR complement verifies the high conservation of the more ancient CCRPW8-type NB-LRRs. Use of RenSeq on cDNA from uninfected and late blight-infected tomato leaves allows the avoidance of sequence analysis of non-expressed paralogues.

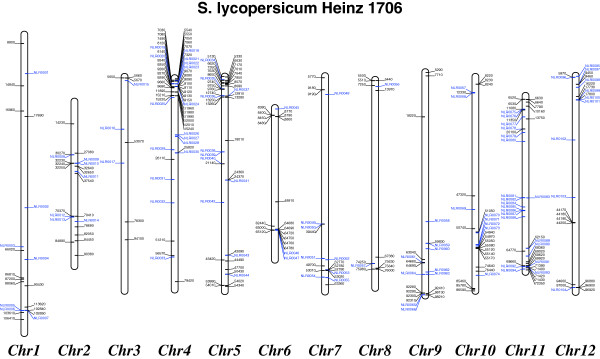
Conclusion: RenSeq is a promising method to facilitate analysis of plant resistance gene complements. The reannotated tomato NB-LRR complements, phylogenetic relationships and chromosomal locations provided in this paper will provide breeders and scientists with a useful tool to identify novel disease resistance traits. cDNA RenSeq enables for the first time next-gen sequencing approaches targeted to this very low-expressed gene family without the need for normalization.


Figures

Figure 1
Figure 1
Reannotation of two erroneously fused/split NB-LRR genes. (A) Mapping of RenSeq reads identified two distinct patterns within Solyc01g102880, suggesting a fusion of two genes (blue box); (B) In contrast, Solyc07g055380 and Solyc07g055390 are predicted individual genes (red box), however a gap-free RenSeq read coverage pattern suggested that both are part of one longer sequence. The corrected annotation was confirmed in a MAST analysis using NB-LRR specific MEME motifs (TIR, NB and LRR motifs are shown in green, red and blue boxes, respectively [10]) and are depicted as boxed arrows (green) for the novel full-length TIR-NB-LRR genes RDC0002NLR0005, RDC0002NLR0006 and RDC0002NLR0052.
Figure 2
Figure 2
Detailed analysis of a NB-LRR cluster between positions 1.81-1.87 Mb on chromosome 4. (A) The Heinz 1706 region with annotations from Andolfo et al. [7]. NB-LRR genes are depicted as blue boxes. (B) Illumina MiSeq-platform RenSeq read coverage is shown with green peaks and identifies one yet unannotated NB-LRR RDC0002NLR0019 (red box). The purple boxes indicate stretches of N’s as unknown genomic sequences (Gap1 to Gap4, in violet). (C) Close-up of the analysed loci in which gaps were closed. Previous gene models (blue boxes), novel models (red boxes) and RenSeq read coverage (green peaks) are shown. (D) Representation of the reannotated NB-LRR gene cluster.
Figure 3
Figure 3
Chromosomal distribution of Heinz 1706 NB-LRR genes. The previously annotated NB-LRR genes [7] are shown in black and those discovered in this study are blue. Genes depicted to the left of the chromosome are on the forward strand and those on the right are on the reverse strand.
Figure 4
Figure 4
Phylogenetic analysis of the reannotated Heinz 1706 NB-LRR genes. Full NB-ARC domains of 240 reannotated NB-LRR genes were used together with 30 functionally characterized plant R genes (green font) to do a maximum likelihood analysis based on the Whelan and Goldman model. Clades are collapsed based on a bootstrap value over 79 and numerated. The TNL clade is drawn with a yellow background. Expressed genes, as identified by the cDNA RenSeq analysis, are in red font. Evolutionary analyses were conducted in MEGA5. Labels show the gene IDs (red for expressed NB-LRR genes; black for not-expressed genes). Bootstrap values higher than 79 (out of 100), are indicated above the branches. The tree is drawn to scale, with branch lengths proportional to the number of substitutions per site.
Figure 5
Figure 5
Comparison of the Tm-2 and Sw-5 clusters between Solanum lycopersicum Heinz 1706 and S. tuberosum clone DM and identification of the Ph-3 locus in the tomato genome. (A) Physical mapping position of NB-LRR gene clusters close to the physical Ph-3 locus, based on marker information derived from [15,16]. (B) Phylogenetic analysis performed using the maximum likelihood method, based on the general time reversible model, for homologous sequences of the Tm-2 and Sw-5 clusters. Cartoon potatoes and tomatoes at the end of the branches indicate the origin of the sequence. Bootstrap values (100 replicates) are indicated above branches. (C) Schematic representation of hypothesised gene duplication events that occurred in the tomato and potato genomic region of Tm-2 and Sw-5 clusters. NB-LRR genes are depicted as boxes, and the colors relate to (B).
Figure 6
Figure 6
The evolutionary history of the largest NB-LRR gene cluster involving 16 NB-LRR genes on chromosome 4. (A) Physical mapping position of NB-LRR genes around the potato R2 cluster. (B) The phylogenetic analysis was inferred using the maximum likelihood method based on the general time reversible model in MEGA5. Cartoon potatoes and tomatoes at the end of the branches indicate the origin of the sequence. Bootstrap values higher than 60 are indicated above branches. The tree is drawn to scale, with branch lengths measured in terms of the number of substitutions per site. (C) Schematization of the duplication events that occurred in these genomic regions. Arrows highlight the most probable gene duplication events. NB-LRR genes are depicted as boxes, and the colors relate to (B).

References

    1. Heath MC. Hypersensitive response-related death. Plant Mol Biol. 2000;44:321–334. doi: 10.1023/A:1026592509060. - DOI - PubMed
    1. Dangl JL, Jones JDG. Plant pathogens and integrated defence responses to infection. Nature. 2001;411:826–833. doi: 10.1038/35081161. - DOI - PubMed
    1. Chisholm ST, Coaker G, Day B, Staskawicz BJ. Host-microbe interactions: shaping the evolution of the plant immune response. Cell. 2006;124:803–814. doi: 10.1016/j.cell.2006.02.008. - DOI - PubMed
    1. Jones JDG, Dangl JL. The plant immune system. Nature. 2006;444:323–329. doi: 10.1038/nature05286. - DOI - PubMed
    1. Meyers BC, Kaushik S, Nandety RS. Evolving disease resistance genes. Curr Opin Plant Biol. 2005;8:129–134. doi: 10.1016/j.pbi.2005.01.002. - DOI - PubMed

Publication types

MeSH terms