Using Global Positioning Systems (GPS) and temperature data to generate time-activity classifications for estimating personal exposure in air monitoring studies: an automated method
- PMID: 24885722
- PMCID: PMC4046178
- DOI: 10.1186/1476-069X-13-33
Using Global Positioning Systems (GPS) and temperature data to generate time-activity classifications for estimating personal exposure in air monitoring studies: an automated method
Abstract
Background: Personal exposure studies of air pollution generally use self-reported diaries to capture individuals' time-activity data. Enhancements in the accuracy, size, memory and battery life of personal Global Positioning Systems (GPS) units have allowed for higher resolution tracking of study participants' locations. Improved time-activity classifications combined with personal continuous air pollution sampling can improve assessments of location-related air pollution exposures for health studies.
Methods: Data was collected using a GPS and personal temperature from 54 children with asthma living in Montreal, Canada, who participated in a 10-day personal air pollution exposure study. A method was developed that incorporated personal temperature data and then matched a participant's position against available spatial data (i.e., road networks) to generate time-activity categories. The diary-based and GPS-generated time-activity categories were compared and combined with continuous personal PM2.5 data to assess the impact of exposure misclassification when using diary-based methods.
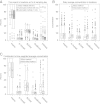
Results: There was good agreement between the automated method and the diary method; however, the automated method (means: outdoors = 5.1%, indoors other =9.8%) estimated less time spent in some locations compared to the diary method (outdoors = 6.7%, indoors other = 14.4%). Agreement statistics (AC1 = 0.778) suggest 'good' agreement between methods over all location categories. However, location categories (Outdoors and Transit) where less time is spent show greater disagreement: e.g., mean time "Indoors Other" using the time-activity diary was 14.4% compared to 9.8% using the automated method. While mean daily time "In Transit" was relatively consistent between the methods, the mean daily exposure to PM2.5 while "In Transit" was 15.9 μg/m3 using the automated method compared to 6.8 μg/m3 using the daily diary.
Conclusions: Mean times spent in different locations as categorized by a GPS-based method were comparable to those from a time-activity diary, but there were differences in estimates of exposure to PM2.5 from the two methods. An automated GPS-based time-activity method will reduce participant burden, potentially providing more accurate and unbiased assessments of location. Combined with continuous air measurements, the higher resolution GPS data could present a different and more accurate picture of personal exposures to air pollution.
Figures


References
-
- Howard-Reed C, Rea AW, Zufall MJ, Burke JM, Williams RW, Suggs JC, Sheldon LS, Walsh D, Kwok R. Use of a continuous nephelometer to measure personal exposure to particles during the U.S. Environmental protection agency Baltimore and Fresno panel studies. J Air Waste Manage Assoc. 2000;50:1125–1132. doi: 10.1080/10473289.2000.10464150. - DOI - PubMed
-
- Wu C-F, Delfino RJ, Floro JN, Quintana PJE, Samimi BS, Kleinman MT, Allen RW, Sally Liu L-J. Exposure assessment and modeling of particulate matter for asthmatic children using personal nephelometers. Atmos Environ. 2005;39:3457–3469. doi: 10.1016/j.atmosenv.2005.01.061. - DOI
-
- Williams R, Suggs J, Rea AW, Sheldon L, Rodes C, Thornburg J. The Research Triangle Park particulate matter panel study: modeling ambient source contribution to personal and residential PM mass concentrations. Atmos Environ. 2003;37:5365–5378. doi: 10.1016/j.atmosenv.2003.09.010. - DOI
MeSH terms
Substances
LinkOut - more resources
Full Text Sources
Other Literature Sources

