

Hypermethylation and down-regulation of DLEU2 in paediatric acute myeloid leukaemia independent of embedded tumour suppressor miR-15a/16-1
- PMID: 24885794
- PMCID: PMC4050407
- DOI: 10.1186/1476-4598-13-123
Hypermethylation and down-regulation of DLEU2 in paediatric acute myeloid leukaemia independent of embedded tumour suppressor miR-15a/16-1
Abstract
Background: Acute Myeloid Leukaemia (AML) is a highly heterogeneous disease. Studies in adult AML have identified epigenetic changes, specifically DNA methylation, associated with leukaemia subtype, age of onset and patient survival which highlights this heterogeneity. However, only limited DNA methylation studies have elucidated any associations in paediatric AML.
Methods: We interrogated DNA methylation on a cohort of paediatric AML FAB subtype M5 patients using the Illumina HumanMethylation450 (HM450) BeadChip, identifying a number of target genes with p <0.01 and Δβ >0.4 between leukaemic and matched remission (n = 20 primary leukaemic, n = 13 matched remission). Amongst those genes identified, we interrogate DLEU2 methylation using locus-specific SEQUENOM MassARRAY® EpiTYPER® and an increased validation cohort (n = 28 primary leukaemic, n = 14 matched remission, n = 17 additional non-leukaemic and cell lines). Following methylation analysis, expression studies were undertaken utilising the same patient samples for singleplex TaqMan gene and miRNA assays and relative expression comparisons.
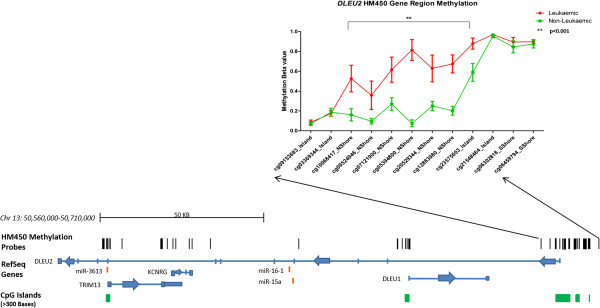
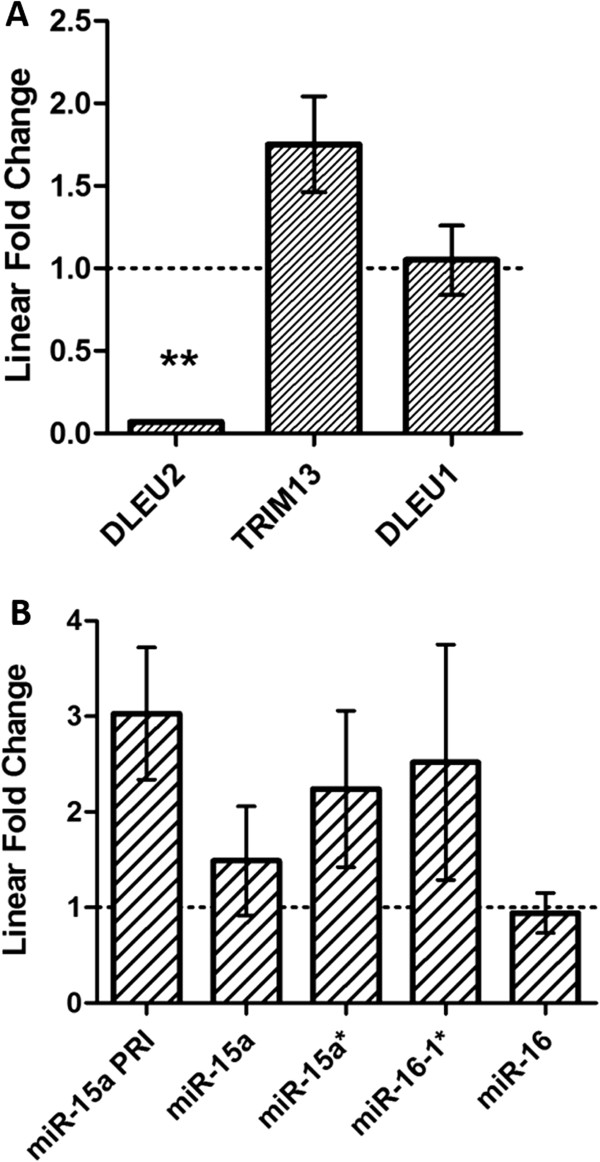
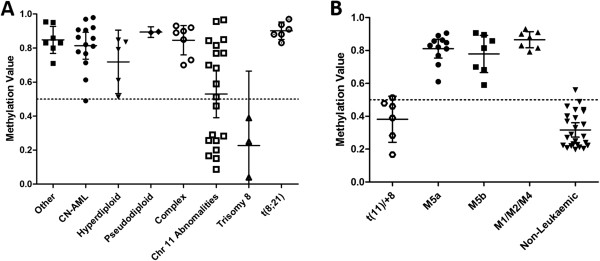
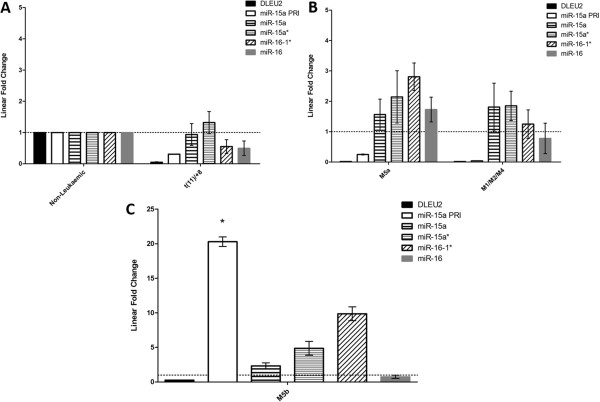
Results: We identified differential DNA methylation at the DLEU2 locus, encompassing the tumour suppressor microRNA miR-15a/16-1 cluster. A number of HM450 probes spanning the DLEU2/Alt1 Transcriptional Start Site showed increased levels of methylation in leukaemia (average over all probes >60%) compared to disease-free haematopoietic cells and patient remission samples (<24%) (p < 0.001). Interestingly, DLEU2 mRNA down-regulation in leukaemic patients (p < 0.05) was independent of the embedded mature miR-15a/16-1 expression. To assess prognostic significance of DLEU2 DNA methylation, we stratified paediatric AML patients by their methylation status. A subset of patients recorded methylation values for DLEU2 akin to non-leukaemic specimens, specifically patients with sole trisomy 8 and/or chromosome 11 abnormalities. These patients also showed similar miR-15a/16-1 expression to non-leukaemic samples, and potential improved disease prognosis.
Conclusions: The DLEU2 locus and embedded miRNA cluster miR-15a/16-1 is commonly deleted in adult cancers and shown to induce leukaemogenesis, however in paediatric AML we found the region to be transcriptionally repressed. In combination, our data highlights the utility of interrogating DNA methylation and microRNA in combination with underlying genetic status to provide novel insights into AML biology.
Figures
Similar articles
-
Therapeutic implications of activation of the host gene (Dleu2) promoter for miR-15a/16-1 in chronic lymphocytic leukemia.Oncogene. 2014 Jun 19;33(25):3307-15. doi: 10.1038/onc.2013.291. Epub 2013 Sep 2. Oncogene. 2014. PMID: 23995789 Free PMC article.
-
Role of Circular RNA DLEU2 in Human Acute Myeloid Leukemia.Mol Cell Biol. 2018 Sep 28;38(20):e00259-18. doi: 10.1128/MCB.00259-18. Print 2018 Oct 15. Mol Cell Biol. 2018. PMID: 30037980 Free PMC article.
-
DLEU2, frequently deleted in malignancy, functions as a critical host gene of the cell cycle inhibitory microRNAs miR-15a and miR-16-1.Exp Cell Res. 2009 Oct 15;315(17):2941-52. doi: 10.1016/j.yexcr.2009.07.001. Epub 2009 Jul 8. Exp Cell Res. 2009. PMID: 19591824
-
[Biological properties and sensitivity to induction therapy of differentiated cells expressing atypical immunophenotype in acute leukemia of children].Folia Med Cracov. 2001;42(3):5-80. Folia Med Cracov. 2001. PMID: 12353422 Review. Polish.
-
The pathological role and prognostic impact of miR-181 in acute myeloid leukemia.Cancer Genet. 2015 May;208(5):225-9. doi: 10.1016/j.cancergen.2014.12.006. Epub 2015 Jan 7. Cancer Genet. 2015. PMID: 25686674 Free PMC article. Review.
Cited by
-
Long noncoding RNA DLEU2 predicts a poor prognosis and enhances malignant properties in laryngeal squamous cell carcinoma through the miR-30c-5p/PIK3CD/Akt axis.Cell Death Dis. 2020 Jun 18;11(6):472. doi: 10.1038/s41419-020-2581-2. Cell Death Dis. 2020. PMID: 32555190 Free PMC article.
-
Silencing of DLEU2 suppresses pancreatic cancer cell proliferation and invasion by upregulating microRNA-455.Cancer Sci. 2019 May;110(5):1676-1685. doi: 10.1111/cas.13987. Epub 2019 Mar 25. Cancer Sci. 2019. PMID: 30838724 Free PMC article.
-
Platelet RNA signatures for the detection of cancer.Cancer Metastasis Rev. 2017 Jun;36(2):263-272. doi: 10.1007/s10555-017-9674-0. Cancer Metastasis Rev. 2017. PMID: 28681241 Free PMC article. Review.
-
Role of microRNAs, circRNAs and long noncoding RNAs in acute myeloid leukemia.J Hematol Oncol. 2019 May 24;12(1):51. doi: 10.1186/s13045-019-0734-5. J Hematol Oncol. 2019. PMID: 31126316 Free PMC article. Review.
-
Circular RNAs: pivotal role in the leukemogenesis and novel indicators for the diagnosis and prognosis of acute myeloid leukemia.Front Oncol. 2023 Apr 14;13:1149187. doi: 10.3389/fonc.2023.1149187. eCollection 2023. Front Oncol. 2023. PMID: 37124518 Free PMC article. Review.
References
-
- Vardiman JW, Thiele J, Arber DA, Brunning RD, Borowitz MJ, Porwit A, Harris NL, Le Beau MM, Hellstrom-Lindberg E, Tefferi A, Bloomfield CD. The 2008 revision of the World Health Organization (WHO) classification of myeloid neoplasms and acute leukemia: rationale and important changes. Blood. 2009;114:937–951. doi: 10.1182/blood-2009-03-209262. - DOI - PubMed
-
- Figueroa ME, Lugthart S, Li Y, Erpelinck-Verschueren C, Deng X, Christos PJ, Schifano E, Booth J, van Putten W, Skrabanek L, Campagne F, Mazumdar M, Greally JM, Valk PJM, Lowenberg B, Delwel R, Melnick AM. DNA methylation signatures identify biologically distinct subtypes in acute myeloid leukemia. Cancer Cell. 2010;17:13–27. doi: 10.1016/j.ccr.2009.11.020. - DOI - PMC - PubMed
Publication types
MeSH terms
Substances
Grants and funding
LinkOut - more resources
Full Text Sources
Other Literature Sources
Medical
