

Computational approaches for isoform detection and estimation: good and bad news
- PMID: 24885830
- PMCID: PMC4098781
- DOI: 10.1186/1471-2105-15-135
Computational approaches for isoform detection and estimation: good and bad news
Abstract
Background: The main goal of the whole transcriptome analysis is to correctly identify all expressed transcripts within a specific cell/tissue--at a particular stage and condition--to determine their structures and to measure their abundances. RNA-seq data promise to allow identification and quantification of transcriptome at unprecedented level of resolution, accuracy and low cost. Several computational methods have been proposed to achieve such purposes. However, it is still not clear which promises are already met and which challenges are still open and require further methodological developments.
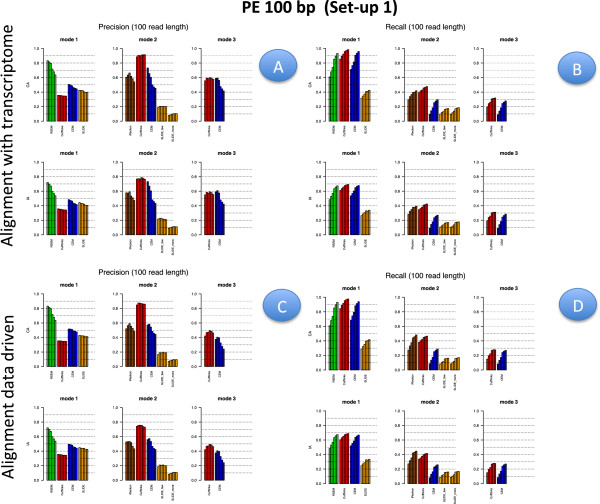
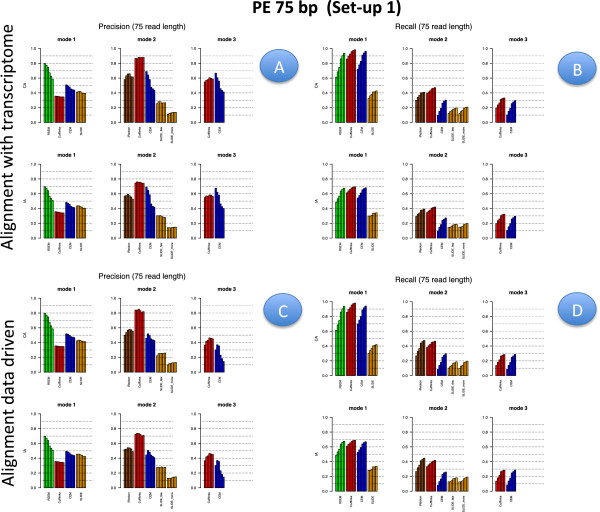
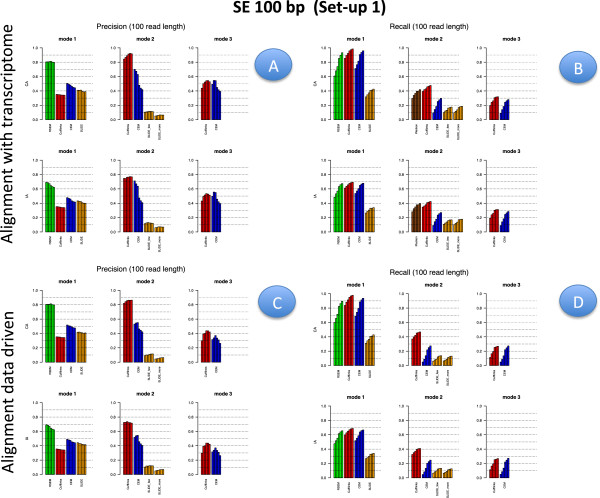
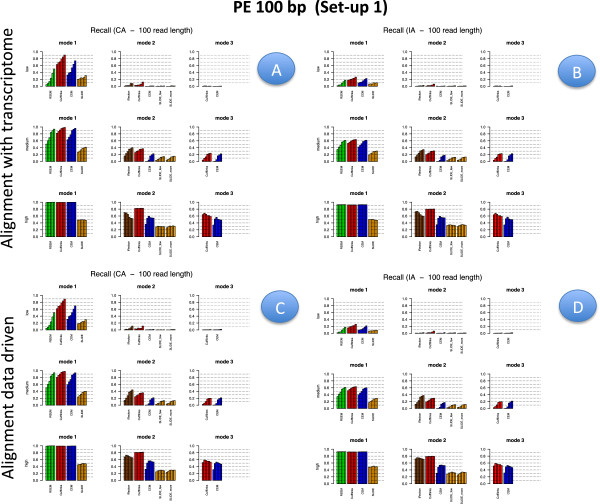
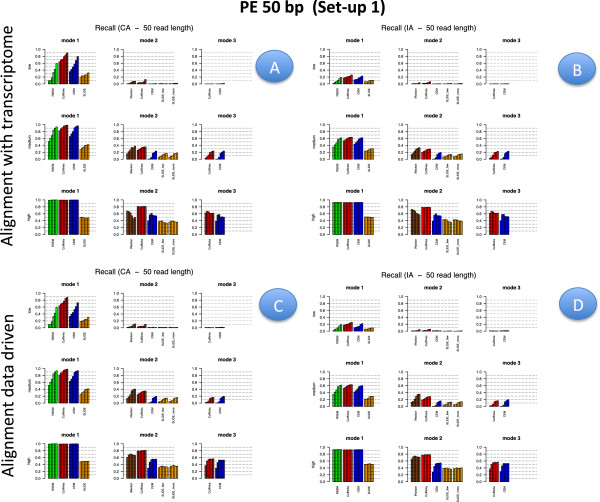
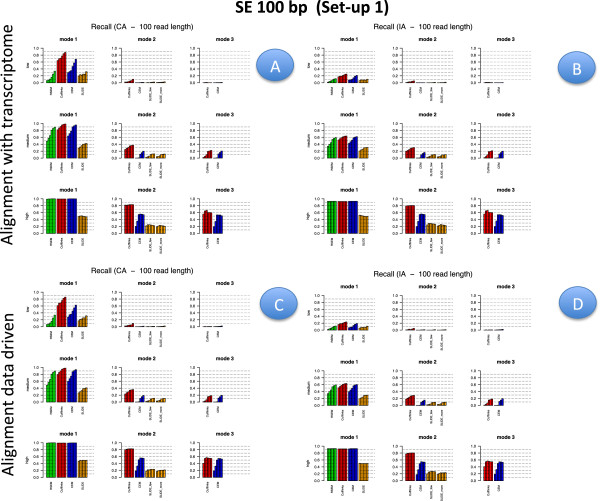
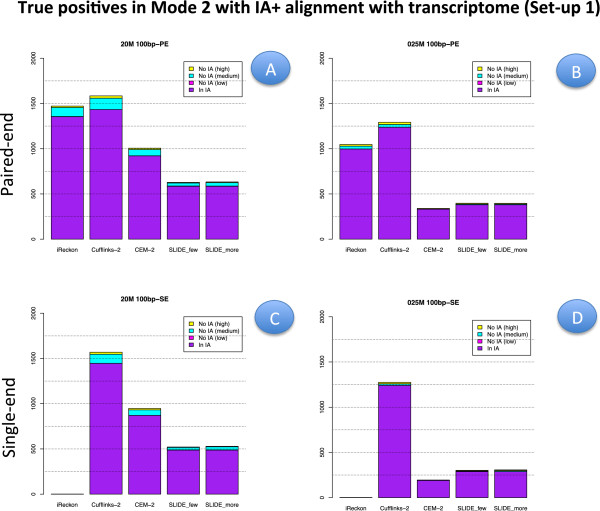
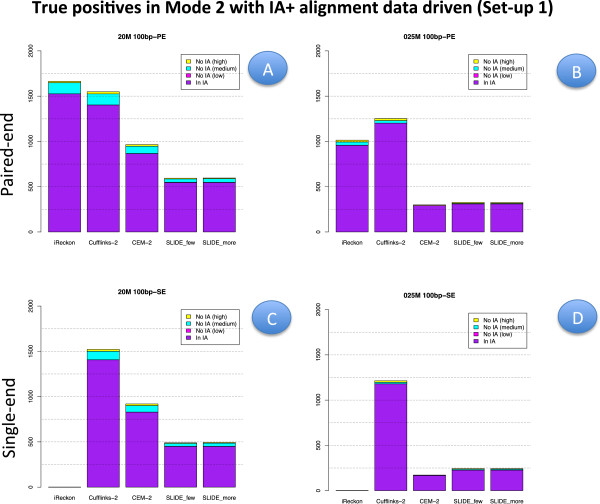
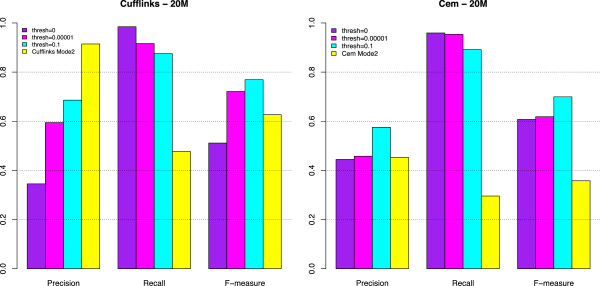
Results: We carried out a simulation study to assess the performance of 5 widely used tools, such as: CEM, Cufflinks, iReckon, RSEM, and SLIDE. All of them have been used with default parameters. In particular, we considered the effect of the following three different scenarios: the availability of complete annotation, incomplete annotation, and no annotation at all. Moreover, comparisons were carried out using the methods in three different modes of action. In the first mode, the methods were forced to only deal with those isoforms that are present in the annotation; in the second mode, they were allowed to detect novel isoforms using the annotation as guide; in the third mode, they were operating in fully data driven way (although with the support of the alignment on the reference genome). In the latter modality, precision and recall are quite poor. On the contrary, results are better with the support of the annotation, even though it is not complete. Finally, abundance estimation error often shows a very skewed distribution. The performance strongly depends on the true real abundance of the isoforms. Lowly (and sometimes also moderately) expressed isoforms are poorly detected and estimated. In particular, lowly expressed isoforms are identified mainly if they are provided in the original annotation as potential isoforms.
Conclusions: Both detection and quantification of all isoforms from RNA-seq data are still hard problems and they are affected by many factors. Overall, the performance significantly changes since it depends on the modes of action and on the type of available annotation. Results obtained using complete or partial annotation are able to detect most of the expressed isoforms, even though the number of false positives is often high. Fully data driven approaches require more attention, at least for complex eucaryotic genomes. Improvements are desirable especially for isoform quantification and for isoform detection with low abundance.
Figures


Similar articles
-
Updating RNA-Seq analyses after re-annotation.Bioinformatics. 2013 Jul 1;29(13):1631-7. doi: 10.1093/bioinformatics/btt197. Epub 2013 May 14. Bioinformatics. 2013. PMID: 23677943 Free PMC article.
-
RSEM: accurate transcript quantification from RNA-Seq data with or without a reference genome.BMC Bioinformatics. 2011 Aug 4;12:323. doi: 10.1186/1471-2105-12-323. BMC Bioinformatics. 2011. PMID: 21816040 Free PMC article.
-
AIDE: annotation-assisted isoform discovery with high precision.Genome Res. 2019 Dec;29(12):2056-2072. doi: 10.1101/gr.251108.119. Epub 2019 Nov 6. Genome Res. 2019. PMID: 31694868 Free PMC article.
-
Comparative evaluation of full-length isoform quantification from RNA-Seq.BMC Bioinformatics. 2021 May 25;22(1):266. doi: 10.1186/s12859-021-04198-1. BMC Bioinformatics. 2021. PMID: 34034652 Free PMC article. Review.
-
Computational methods for transcriptome annotation and quantification using RNA-seq.Nat Methods. 2011 Jun;8(6):469-77. doi: 10.1038/nmeth.1613. Epub 2011 May 27. Nat Methods. 2011. PMID: 21623353 Review.
Cited by
-
Comparative assessment of methods for the computational inference of transcript isoform abundance from RNA-seq data.Genome Biol. 2015 Jul 23;16(1):150. doi: 10.1186/s13059-015-0702-5. Genome Biol. 2015. PMID: 26201343 Free PMC article.
-
Union Exon Based Approach for RNA-Seq Gene Quantification: To Be or Not to Be?PLoS One. 2015 Nov 11;10(11):e0141910. doi: 10.1371/journal.pone.0141910. eCollection 2015. PLoS One. 2015. PMID: 26559532 Free PMC article.
-
Using Synthetic Mouse Spike-In Transcripts to Evaluate RNA-Seq Analysis Tools.PLoS One. 2016 Apr 21;11(4):e0153782. doi: 10.1371/journal.pone.0153782. eCollection 2016. PLoS One. 2016. PMID: 27100792 Free PMC article.
-
Pervasive isoform-specific translational regulation via alternative transcription start sites in mammals.Mol Syst Biol. 2016 Jul 18;12(7):875. doi: 10.15252/msb.20166941. Mol Syst Biol. 2016. PMID: 27430939 Free PMC article.
-
Understanding gene regulatory mechanisms by integrating ChIP-seq and RNA-seq data: statistical solutions to biological problems.Front Cell Dev Biol. 2014 Sep 17;2:51. doi: 10.3389/fcell.2014.00051. eCollection 2014. Front Cell Dev Biol. 2014. PMID: 25364758 Free PMC article.
References
-
- Harrow J, Frankish A, Gonzalez JM, Tapanari E, Diekhans M, Kokocinski F, Aken BL, Barrell D, Zadissa A, Searle S, Barnes I, Bignell A, Boychenko V, Hunt T, Kay M, Mukherjee G, Rajan J, Despacio-Reyes G, Saunders G, Steward C, Harte R, Lin M, Howald C, Tanzer A, Derrien T, Chrast J, Walters N, Balasubramanian S, Pei B, Tress M. et al.GENCODE: the reference human genome annotation for The ENCODE project. Genome Res. 2012;22(9):1760–1774. - PMC - PubMed
-
- Djebali S, Davis CA, Merkel A, Dobin A, Lassmann T, Mortazavi A, Tanzer A, Lagarde J, Lin W, Schlesinger F, Xue C, Marinov GK, Khatun J, Williams BA, Zaleski C, Rozowsky J, Röder M, Kokocinski F, Abdelhamid RF, Alioto T, Antoshechkin I, Baer MT, Bar NS, Batut P, Bell K, Bell I, Chakrabortty S, Chen X, Chrast J, Curado J. et al.Landscape of transcription in human cells. Nature. 2012;489:101–108. - PMC - PubMed
-
- Mortazavi A, Williams B, McCue K, Schaeffer L, Wold B. Mapping and quantifying mammalian transcriptomes by RNA-Seq. Nat Methods. 2008;5:621–628. - PubMed
Publication types
MeSH terms
Substances
LinkOut - more resources
Full Text Sources
Other Literature Sources
Research Materials
Miscellaneous
