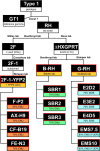
Whole genome profiling of spontaneous and chemically induced mutations in Toxoplasma gondii
- PMID: 24885922
- PMCID: PMC4035079
- DOI: 10.1186/1471-2164-15-354
Whole genome profiling of spontaneous and chemically induced mutations in Toxoplasma gondii
Abstract
Background: Next generation sequencing is helping to overcome limitations in organisms less accessible to classical or reverse genetic methods by facilitating whole genome mutational analysis studies. One traditionally intractable group, the Apicomplexa, contains several important pathogenic protozoan parasites, including the Plasmodium species that cause malaria.Here we apply whole genome analysis methods to the relatively accessible model apicomplexan, Toxoplasma gondii, to optimize forward genetic methods for chemical mutagenesis using N-ethyl-N-nitrosourea (ENU) and ethylmethane sulfonate (EMS) at varying dosages.
Results: By comparing three different lab-strains we show that spontaneously generated mutations reflect genome composition, without nucleotide bias. However, the single nucleotide variations (SNVs) are not distributed randomly over the genome; most of these mutations reside either in non-coding sequence or are silent with respect to protein coding. This is in contrast to the random genomic distribution of mutations induced by chemical mutagenesis. Additionally, we report a genome wide transition vs transversion ratio (ti/tv) of 0.91 for spontaneous mutations in Toxoplasma, with a slightly higher rate of 1.20 and 1.06 for variants induced by ENU and EMS respectively. We also show that in the Toxoplasma system, surprisingly, both ENU and EMS have a proclivity for inducing mutations at A/T base pairs (78.6% and 69.6%, respectively).
Conclusions: The number of SNVs between related laboratory strains is relatively low and managed by purifying selection away from changes to amino acid sequence. From an experimental mutagenesis point of view, both ENU (24.7%) and EMS (29.1%) are more likely to generate variation within exons than would naturally accumulate over time in culture (19.1%), demonstrating the utility of these approaches for yielding proportionally greater changes to the amino acid sequence. These results will not only direct the methods of future chemical mutagenesis in Toxoplasma, but also aid in designing forward genetic approaches in less accessible pathogenic protozoa as well.
Figures


Similar articles
-
Marked differences in the role of O6-alkylguanine in hprt mutagenesis in T-lymphocytes of rats exposed in vivo to ethylmethanesulfonate, N-(2-hydroxyethyl)-N-nitrosourea, or N-ethyl-N-nitrosourea.Cancer Res. 1995 May 1;55(9):1875-82. Cancer Res. 1995. PMID: 7728755
-
Mutational pattern and frequency of induced nucleotide changes in mouse ENU mutagenesis.BMC Mol Biol. 2007 Jun 20;8:52. doi: 10.1186/1471-2199-8-52. BMC Mol Biol. 2007. PMID: 17584492 Free PMC article.
-
Whole-genome profiling of mutagenesis in Caenorhabditis elegans.Genetics. 2010 Jun;185(2):431-41. doi: 10.1534/genetics.110.116616. Epub 2010 May 3. Genetics. 2010. PMID: 20439774 Free PMC article.
-
Genome-wide ENU mutagenesis for the discovery of novel male fertility regulators.Syst Biol Reprod Med. 2010 Jun;56(3):246-59. doi: 10.3109/19396361003706424. Syst Biol Reprod Med. 2010. PMID: 20536324 Review.
-
Functional genetics in Apicomplexa: potentials and limits.FEBS Lett. 2011 Jun 6;585(11):1579-88. doi: 10.1016/j.febslet.2011.05.002. Epub 2011 May 8. FEBS Lett. 2011. PMID: 21557944 Review.
Cited by
-
Coupling chemical mutagenesis to next generation sequencing for the identification of drug resistance mutations in Leishmania.Nat Commun. 2019 Dec 9;10(1):5627. doi: 10.1038/s41467-019-13344-6. Nat Commun. 2019. PMID: 31819054 Free PMC article.
-
Genetic Modifiers and Rare Mendelian Disease.Genes (Basel). 2020 Feb 25;11(3):239. doi: 10.3390/genes11030239. Genes (Basel). 2020. PMID: 32106447 Free PMC article. Review.
-
TSLP and TSLP receptors variants are associated with smoking.Mol Genet Genomic Med. 2019 Aug;7(8):e842. doi: 10.1002/mgg3.842. Epub 2019 Jul 9. Mol Genet Genomic Med. 2019. PMID: 31290290 Free PMC article.
-
Variation detection based on next-generation sequencing of type Chinese 1 strains of Toxoplasma gondii with different virulence from China.BMC Genomics. 2015 Oct 30;16:888. doi: 10.1186/s12864-015-2106-z. BMC Genomics. 2015. PMID: 26518334 Free PMC article.
-
Mutational Analysis of N-Ethyl-N-Nitrosourea (ENU) in the Fission Yeast Schizosaccharomyces pombe.G3 (Bethesda). 2020 Mar 5;10(3):917-923. doi: 10.1534/g3.119.400936. G3 (Bethesda). 2020. PMID: 31900332 Free PMC article.
References
Publication types
MeSH terms
Substances
Associated data
- Actions
Grants and funding
LinkOut - more resources
Full Text Sources
Other Literature Sources
Miscellaneous

