

A combined model of human erythropoiesis and granulopoiesis under growth factor and chemotherapy treatment
- PMID: 24886056
- PMCID: PMC4046020
- DOI: 10.1186/1742-4682-11-24
A combined model of human erythropoiesis and granulopoiesis under growth factor and chemotherapy treatment
Abstract
Background: Haematotoxicity of conventional chemotherapies often results in delays of treatment or reduction of chemotherapy dose. To ameliorate these side-effects, patients are routinely treated with blood transfusions or haematopoietic growth factors such as erythropoietin (EPO) or granulocyte colony-stimulating factor (G-CSF). For the latter ones, pharmaceutical derivatives are available, which differ in absorption kinetics, pharmacokinetic and -dynamic properties. Due to the complex interaction of cytotoxic effects of chemotherapy and the stimulating effects of different growth factor derivatives, optimal treatment is a non-trivial task. In the past, we developed mathematical models of thrombopoiesis, granulopoiesis and erythropoiesis under chemotherapy and growth-factor applications which can be used to perform clinically relevant predictions regarding the feasibility of chemotherapy schedules and cytopenia prophylaxis with haematopoietic growth factors. However, interactions of lineages and growth-factors were ignored so far.
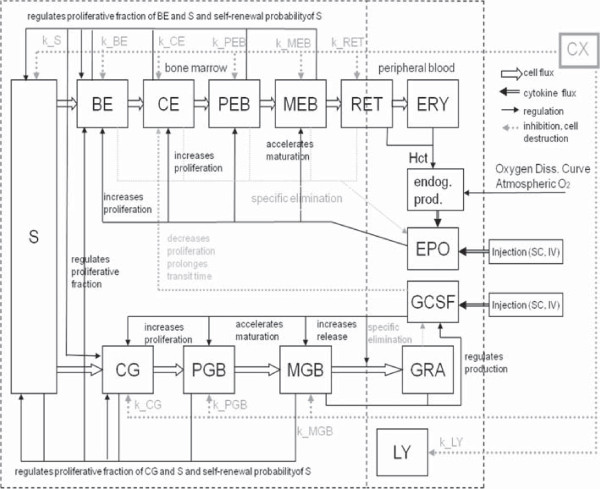
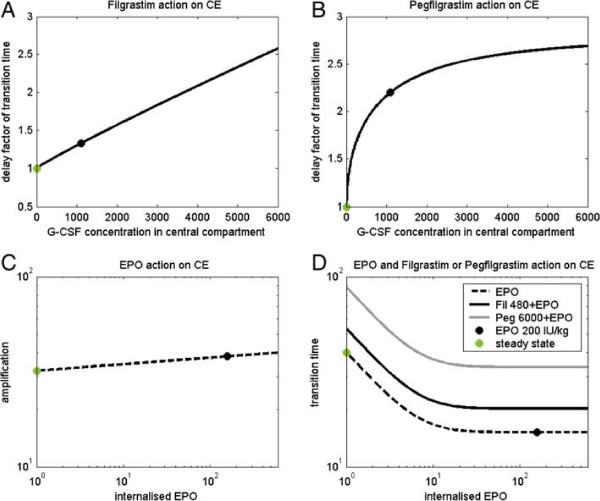
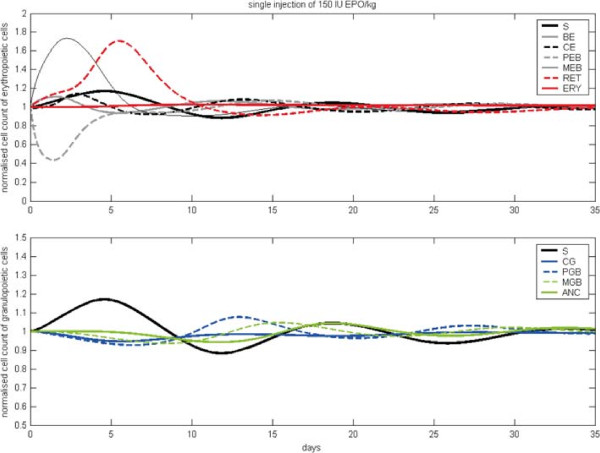
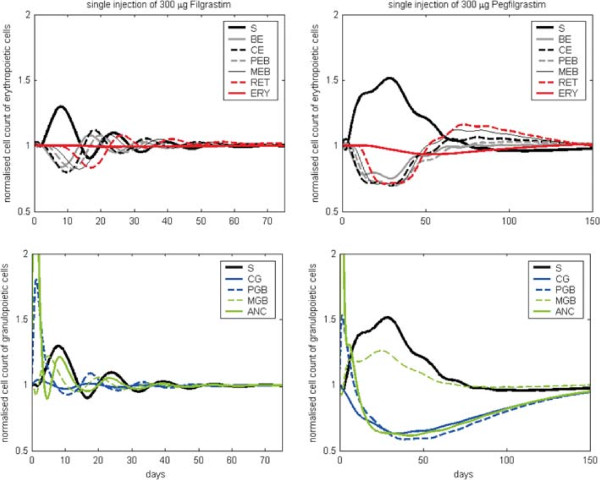
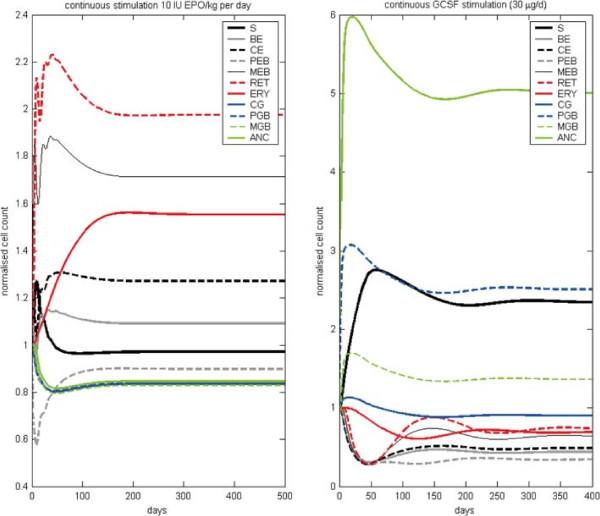
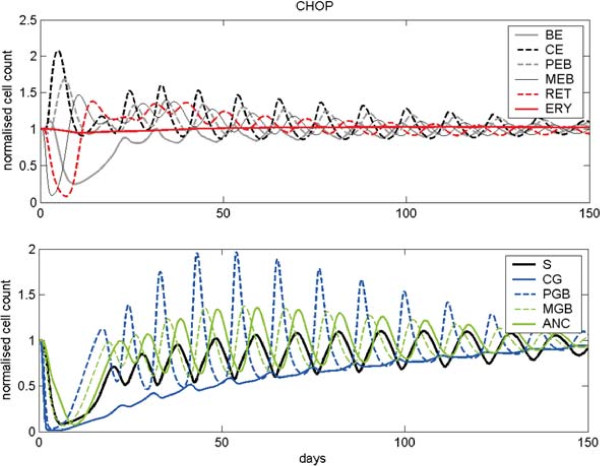
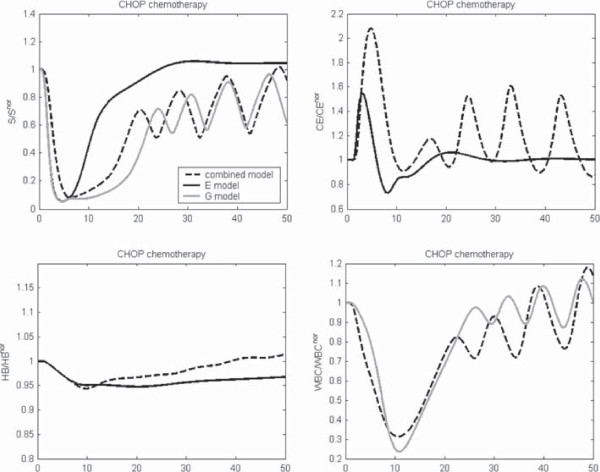
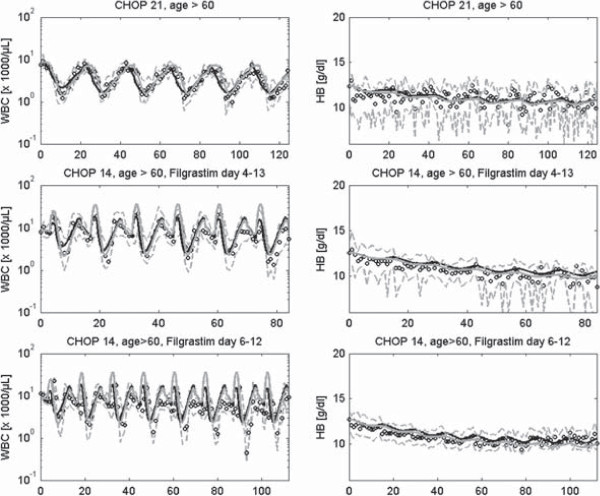
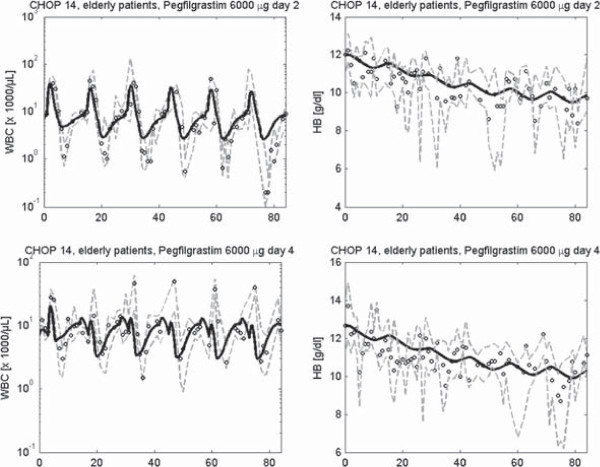
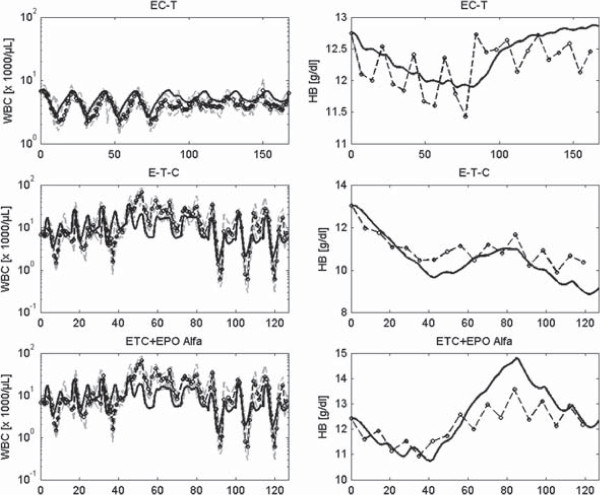
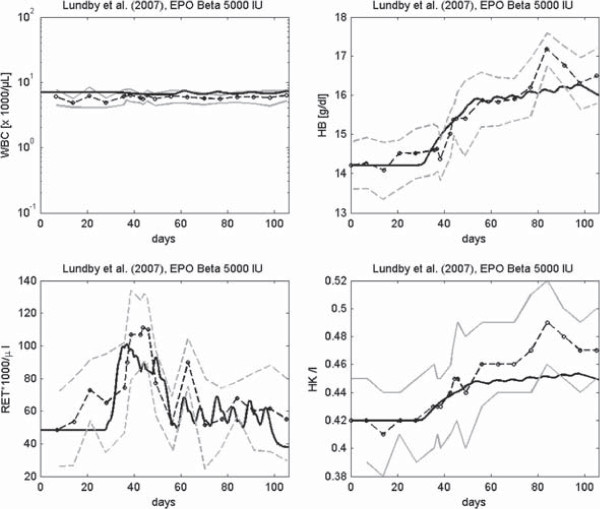
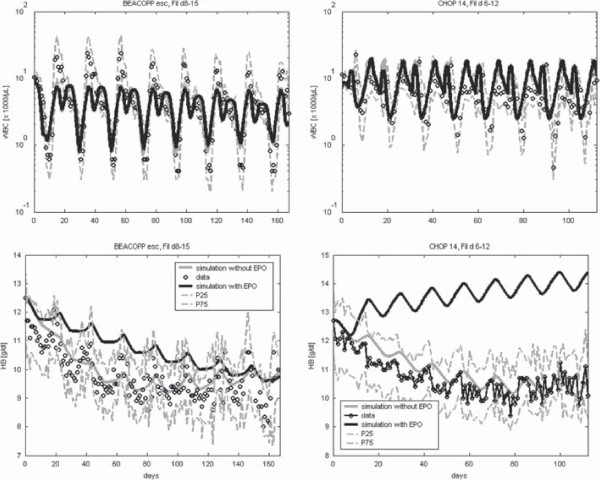
Results: To close this gap, we constructed a hybrid model of human granulopoiesis and erythropoiesis under conventional chemotherapy, G-CSF and EPO applications. This was achieved by combining our single lineage models of human erythropoiesis and granulopoiesis with a common stem cell model. G-CSF effects on erythropoiesis were also implemented. Pharmacodynamic models are based on ordinary differential equations describing proliferation and maturation of haematopoietic cells. The system is regulated by feedback loops partly mediated by endogenous and exogenous EPO and G-CSF. Chemotherapy is modelled by depletion of cells. Unknown model parameters were determined by fitting the model predictions to time series data of blood counts and cytokine profiles. Data were extracted from literature or received from cooperating clinical study groups. Our model explains dynamics of mature blood cells and cytokines after growth-factor applications in healthy volunteers. Moreover, we modelled 15 different chemotherapeutic drugs by estimating their bone marrow toxicity. Taking into account different growth-factor schedules, this adds up to 33 different chemotherapy regimens explained by the model.
Conclusions: We conclude that we established a comprehensive biomathematical model to explain the dynamics of granulopoiesis and erythropoiesis under combined chemotherapy, G-CSF, and EPO applications. We demonstrate how it can be used to make predictions regarding haematotoxicity of yet untested chemotherapy and growth-factor schedules.
Figures
Similar articles
-
Pharmacokinetic and -dynamic modelling of G-CSF derivatives in humans.Theor Biol Med Model. 2012 Jul 30;9:32. doi: 10.1186/1742-4682-9-32. Theor Biol Med Model. 2012. PMID: 22846180 Free PMC article.
-
A biomathematical model of human erythropoiesis under erythropoietin and chemotherapy administration.PLoS One. 2013 Jun 6;8(6):e65630. doi: 10.1371/journal.pone.0065630. Print 2013. PLoS One. 2013. PMID: 23755260 Free PMC article.
-
Mutual inhibition of murine erythropoiesis and granulopoiesis during combined erythropoietin, granulocyte colony-stimulating factor, and stem cell factor administration: in vivo interactions and dose-response surfaces.Blood. 1994 Dec 15;84(12):4157-63. Blood. 1994. PMID: 7527670
-
Erythropoietin (EPO) as a Key Regulator of Erythropoiesis, Bone Remodeling and Endothelial Transdifferentiation of Multipotent Mesenchymal Stem Cells (MSCs): Implications in Regenerative Medicine.Cells. 2021 Aug 20;10(8):2140. doi: 10.3390/cells10082140. Cells. 2021. PMID: 34440909 Free PMC article. Review.
-
Granulocyte-macrophage colony stimulating factor and interleukin 3: target cells and kinetics of response in vivo.Stem Cells. 1993 Jul;11 Suppl 2:83-7. doi: 10.1002/stem.5530110814. Stem Cells. 1993. PMID: 8401260 Review.
Cited by
-
A Biomathematical Model of Pneumococcal Lung Infection and Antibiotic Treatment in Mice.PLoS One. 2016 May 19;11(5):e0156047. doi: 10.1371/journal.pone.0156047. eCollection 2016. PLoS One. 2016. PMID: 27196107 Free PMC article.
-
Quantifying the removal of red blood cells in Macaca mulatta during a Plasmodium coatneyi infection.Malar J. 2016 Aug 12;15(1):410. doi: 10.1186/s12936-016-1465-5. Malar J. 2016. PMID: 27520455 Free PMC article.
-
Multistage feedback-driven compartmental dynamics of hematopoiesis.iScience. 2021 Mar 18;24(4):102326. doi: 10.1016/j.isci.2021.102326. eCollection 2021 Apr 23. iScience. 2021. PMID: 33889822 Free PMC article.
-
Quantitative systems pharmacology model of erythropoiesis to simulate therapies targeting anemia due to chronic kidney disease.Front Pharmacol. 2023 Dec 6;14:1274490. doi: 10.3389/fphar.2023.1274490. eCollection 2023. Front Pharmacol. 2023. PMID: 38125882 Free PMC article.
-
Model-based optimization of G-CSF treatment during cytotoxic chemotherapy.J Cancer Res Clin Oncol. 2018 Feb;144(2):343-358. doi: 10.1007/s00432-017-2540-1. Epub 2017 Nov 4. J Cancer Res Clin Oncol. 2018. PMID: 29103159 Free PMC article.
References
-
- Wunderlich A, Kloess M, Reiser M, Rudolph C, Truemper L, Bittner S, Schmalenberg H, Schmits R, Pfreundschuh M, Loeffler M. Practicability and acute haematological toxicity of 2- and 3-weekly CHOP and CHOEP chemotherapy for aggressive non-Hodgkin’s lymphoma: results from the NHL-B trial of the German High-grade Non-hodgkin’s Lymphoma Study group (DSHNHL) Ann Oncol. 2003;14:881–893. doi: 10.1093/annonc/mdg249. - DOI - PubMed
-
- Zwick C, Hartmann F, Zeynalova S, Pöschel V, Nickenig C, Reiser M, Lengfelder E, Peter N, Schlimok G, Schubert J, Schmitz N, Loeffler M, Pfreundschuh M. Randomized comparison of pegfilgrastim day 4 versus day 2 for the prevention of chemotherapy-induced leukocytopenia. Ann Oncol. 2011;22:1872–1877. doi: 10.1093/annonc/mdq674. - DOI - PubMed
Publication types
MeSH terms
Substances
LinkOut - more resources
Full Text Sources
Other Literature Sources
Research Materials
Miscellaneous
