. 2014 May 27:13:125.
doi: 10.1186/1476-4598-13-125.

DTX3L and ARTD9 inhibit IRF1 expression and mediate in cooperation with ARTD8 survival and proliferation of metastatic prostate cancer cells

Affiliations

DTX3L and ARTD9 inhibit IRF1 expression and mediate in cooperation with ARTD8 survival and proliferation of metastatic prostate cancer cells

Samia B Bachmann et al. Mol Cancer. .

Abstract

Background: Prostate cancer (PCa) is one of the leading causes of cancer-related mortality and morbidity in the aging male population and represents the most frequently diagnosed malignancy in men around the world. The Deltex (DTX)-3-like E3 ubiquitin ligase (DTX3L), also known as B-lymphoma and BAL-associated protein (BBAP), was originally identified as a binding partner of the diphtheria-toxin-like macrodomain containing ADP-ribosyltransferase-9 (ARTD9), also known as BAL1 and PARP9. We have previously demonstrated that ARTD9 acts as a novel oncogenic survival factor in high-risk, chemo-resistant, diffuse large B cell lymphoma (DLBCL). The mono-ADP-ribosyltransferase ARTD8, also known as PARP14 functions as a STAT6-specific co-regulator of IL4-mediated proliferation and survival in B cells.

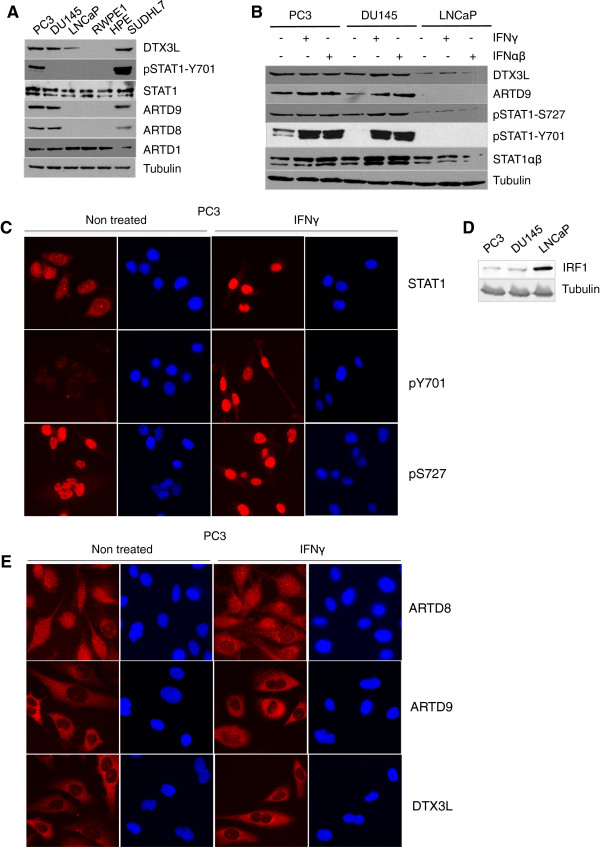
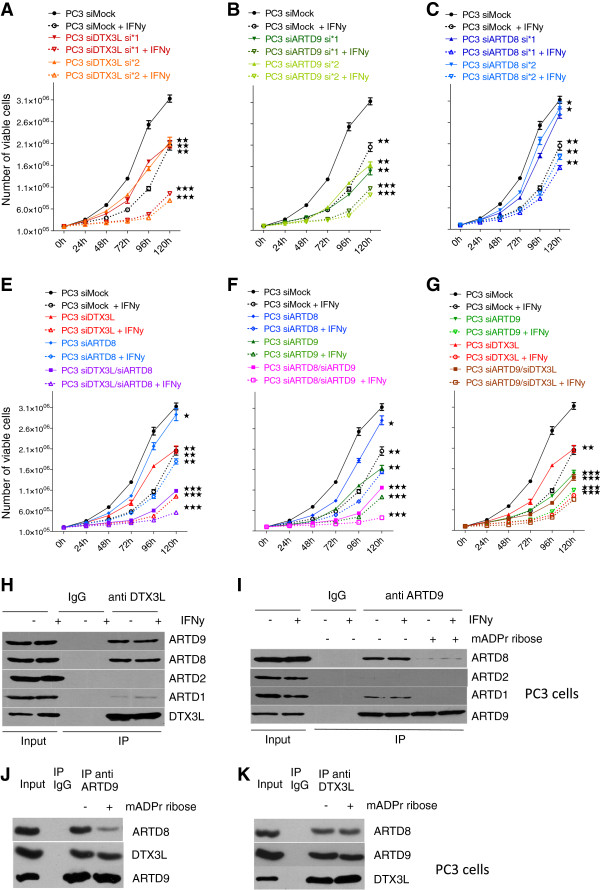
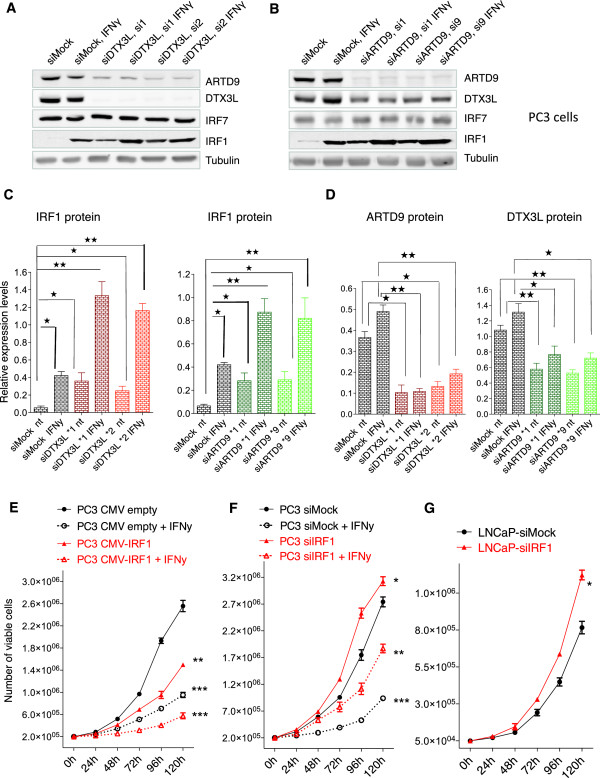
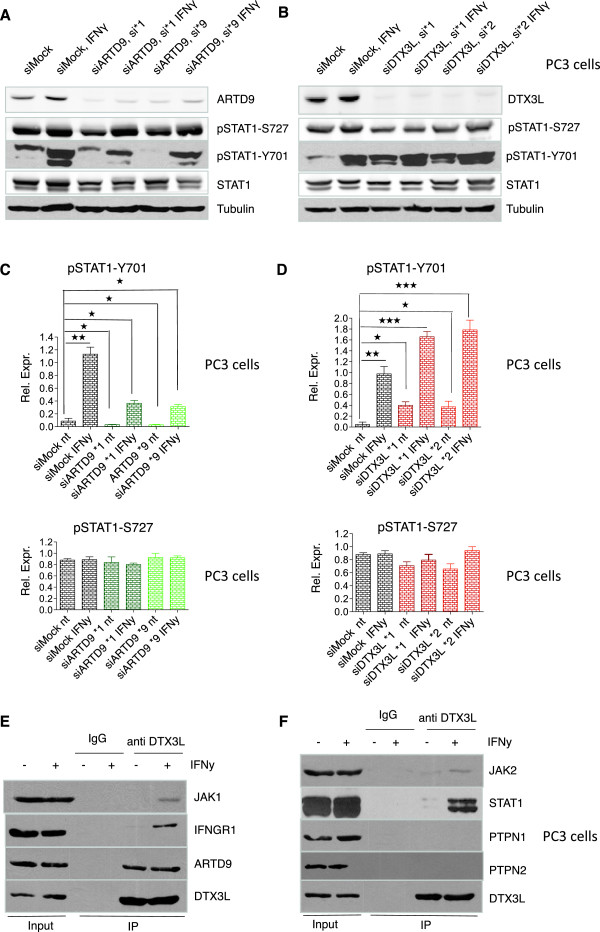
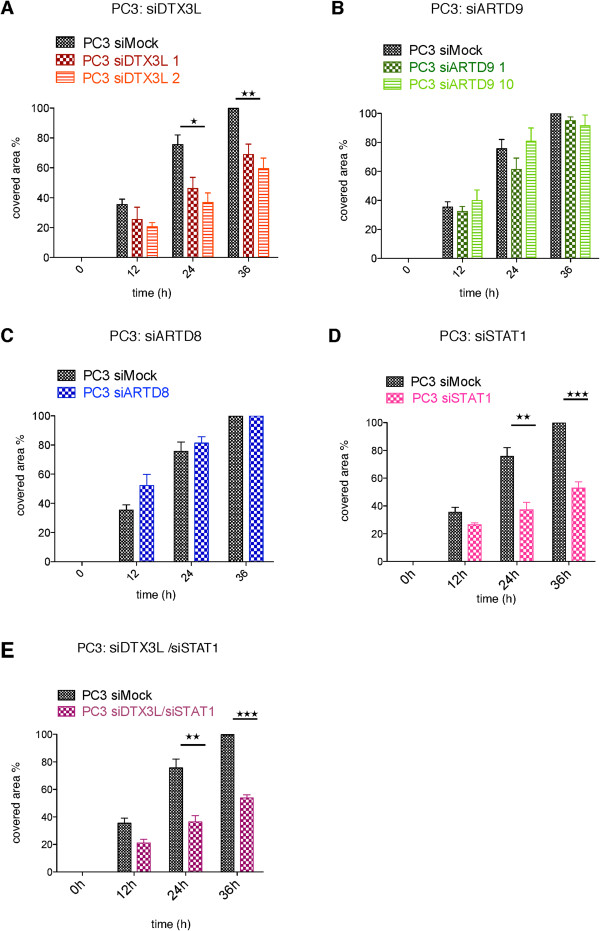
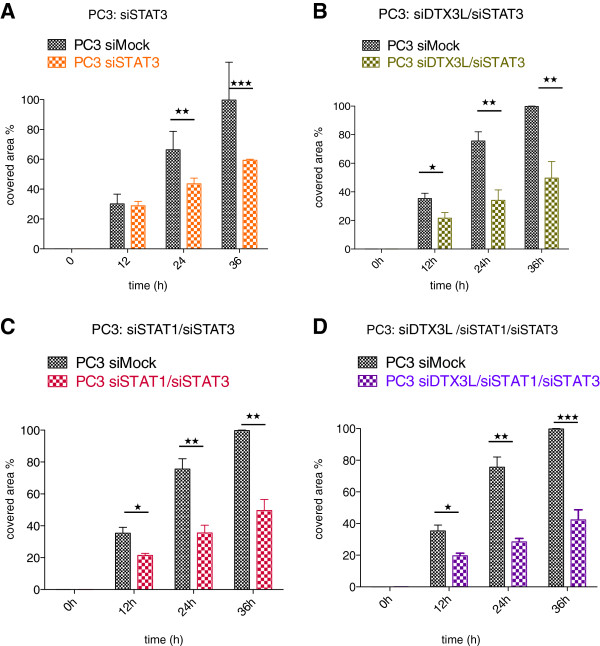
Methods: Co-expression of DTX3L, ARTD8, ARTD9 and STAT1 was analyzed in the metastatic PCa (mPCa) cell lines PC3, DU145, LNCaP and in the normal prostate luminal epithelial cell lines HPE and RWPE1. Effects on cell proliferation, survival and cell migration were determined in PC3, DU145 and/or LNCaP cells depleted of DTX3L, ARTD8, ARTD9, STAT1 and/or IRF1 compared to their proficient control cells, respectively. In further experiments, real-time RT-PCR, Western blot, immunofluorescence and co-immunoprecipitations were conducted to evaluate the physical and functional interactions between DTX3L, ARTD8 and ARTD9.

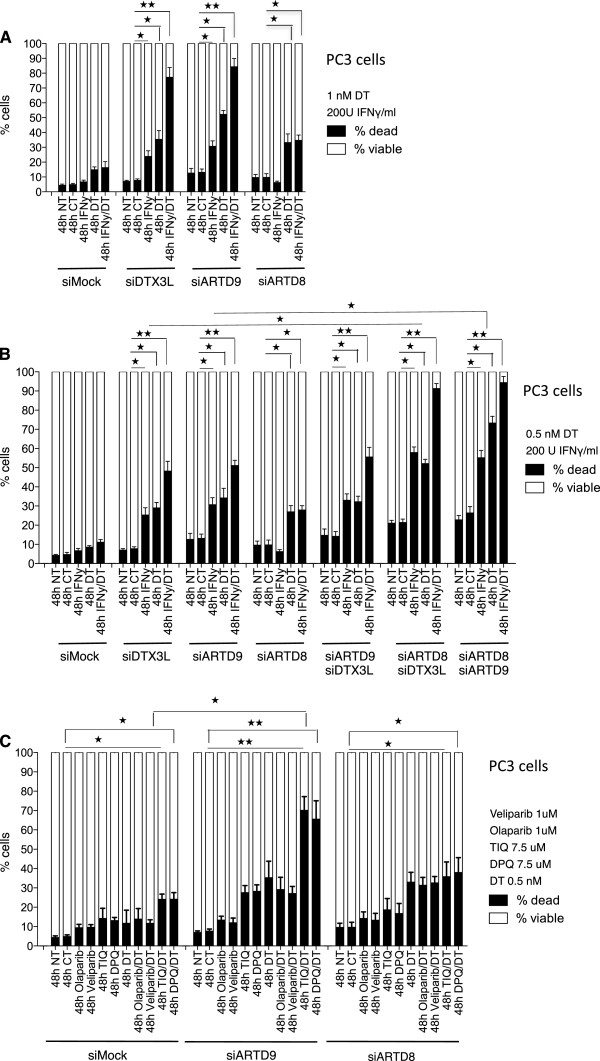
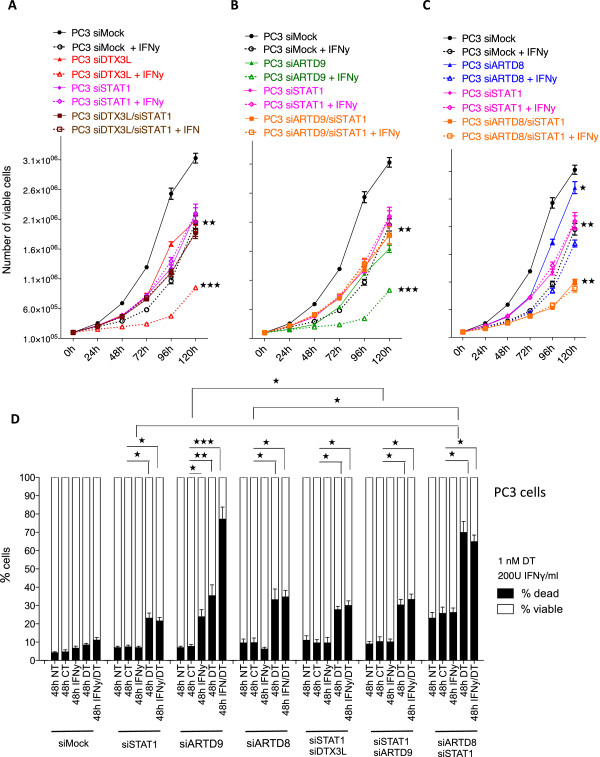
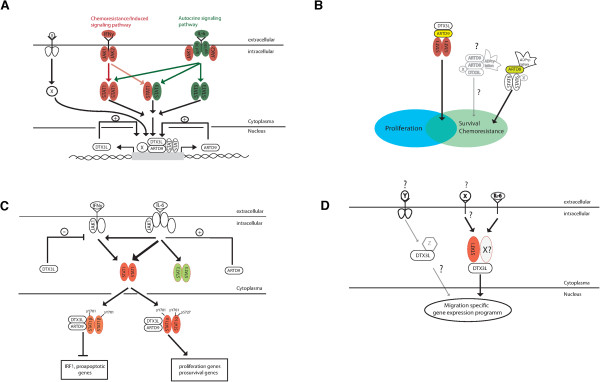
Results: Here we could identify DTX3L, ARTD9 and ARTD8 as novel oncogenic survival factors in mPCa cells. Our studies revealed that DTX3L forms a complex with ARTD8 and mediates together with ARTD8 and ARTD9 proliferation, chemo-resistance and survival of mPCa cells. In addition, DTX3L, ARTD8 and ARTD9 form complexes with each other. Our study provides first evidence that the enzymatic activity of ARTD8 is required for survival of mPCa cells. DTX3L and ARTD9 act together as repressors of the tumor suppressor IRF1 in mPCa cells. Furthermore, the present study shows that DTX3L together with STAT1 and STAT3 is implicated in cell migration of mPCa cells.

Conclusions: Our data strongly indicate that a crosstalk between STAT1, DTX3L and ARTD-like mono-ADP-ribosyltransferases mediates proliferation and survival of mPCa cells. The present study further suggests that the combined targeted inhibition of STAT1, ARTD8, ARTD9 and/or DTX3L could increase the efficacy of chemotherapy or radiation treatment in prostate and other high-risk tumor types with an increased STAT1 signaling.


Figures

Figure 1
Figure 1
DTX3L is constitutively overexpressed together with ARTD8 and ARTD9 in mPCa associated with increased IFNγ/STAT1 signaling. (A) Immunoblot analyses of untreated p53-negative, mPCa cell lines PC3 and DU145, androgen-sensitive and JAK1-negative LNCaP cell line and of the immortalized normal prostate luminal epithelial cell lines HPE and RWPE1. The HR-DLBCL-SUDHL7 cell line constitutively expressing DTX3L, ARTD9 and ARTD8 [23] was used as a positive control. Whole cell extracts were separated by SDS PAGE, blotted and subsequently probed with antibodies for DTX3L, ARTD1, ARTD8 and ARTD9 pSTAT1(Y701) and tubulin. (B) Immunoblot analyses of STAT1-signaling in p53-negative mPCa cell lines PC3 and DU145 and in the androgen-sensitive and JAK1-negative LNCaP cell line treated with or without IFNγ or IFNαβ. PC3, DU145 and LNCaP cells were treated with or without IFNγ (200 U/ml) or IFNαβ (50 U/ml each) for 2 h and then whole cell extracts separated by SDS PAGE and subsequently probed with antibodies for DTX3L, ARTD9, STAT1, pSTAT1(Y701), pSTAT1(S727) and tubulin. The immunoblots are representative of at least three independent experiments. (C) Immunofluorescence microscopy analyses and sub-cellular localization of endogenous STAT1, pSTAT1-(pY701) and pSTAT1-(pS727) in PC3 cells, in presence or absence of 1000 U/ml IFNγ. Original magnification × 400. Images are representative of at least three independent experiments. (D) Immunoblot analyses of basal expression levels of IRF1 in PC3, DU145 and LNCaP cell lines. Whole cell extracts were separated by SDS PAGE and subsequently probed with antibodies for IRF1 and tubulin. The immunoblot is representative of at least three independent experiments. (E) Immunofluorescence microscopy analyses and sub-cellular localization of endogenous DTX3L, ARTD8 and ARDT9 in PC3 cells, in presence or absence of 1000 U/ml IFNγ. Original magnification × 400. Images are representative of at least three independent experiments.
Figure 2
Figure 2
Crosstalk among DTX3L, ARTD8 and ARTD9 mediates proliferation in PC3 cells. (A-F) Cell proliferation analyses of PC3-siMock, PC3-siDTX3L, PC3-siARTD8, PC3-siARTD9 single knockdown cells (A-C) and PC3-siDTX3L/siARTD8, PC3 siDTX3L/siARTD9 or PC3-siARTD9/siARTD8 double knockdown cells (D-F) in presence or absence of IFNγ (200 U/ml) was assessed by the trypan blue exclusion assay. Relative cell proliferation and cell numbers are presented as mean from three independent experiments performed in triplicates. All error bars represent the SE. Statistical analysis was performed using the Student's t test. *P < 0.05, **P < 0.001 and ***P < 0.0001. (G) Co-immunoprecipitation analyses of endogenous DTX3L and ARTD family members in PC3 cells. PC3 cells were stimulated for 1 h with or without IFNγ (200 U/ml) and endogenous DTX3L complexes were then co-immunoprecipitated, separated on SDS PAGE, blotted and subsequently probed with antibodies for DTX3L, ARTD1 (positive control), ARTD2, ARTD8 and ARTD9. (H) Interaction of endogenous ARDT9 and ARTD1 or ARTD8 is mediated by (mono)-ADP-ribosylation. PC3 cells were stimulated for 1 h with IFNγ (200 U/ml) and endogenous ARTD9-ARTDx complexes subsequently co-immunoprecipitated in presence or absence of 5 mM mono-ADP-ribose using an anti-ARTD9 antibody. Complexes were then separated on SDS PAGE, blotted and subsequently probed with antibodies against endogenous ARTD1 (positive control), ARTD2, ARTD8 and ARTD9. (I, J) Interaction between endogenous DTX3L and ARTD8 or ARTD9 is independent of (mono)-ADP-ribosylation. Endogenous DTX3L-ARTD8/9 complexes were co-immunoprecipitated from extracts of PC3 cells in presence or absence of 5 mM mono-ADP-ribose using either an anti-ARTD9 (I) or an anti-DTX3L (J) antibody. Complexes were then separated on SDS PAGE, blotted and subsequently probed with antibodies against endogenous ARTD8, ARTD9 and DTX3L.
Figure 3
Figure 3
Crosstalk among DTX3L, ARTD8 and ARTD9 mediates chemo-resistance and survival in PC3 cells and is dependent on ADP-ribosylation. (A) Cell viability analyses of PC3-siMock, PC3-siDTX3L, PC3-siARTD8 and PC3-siARTD9 single knockdown cells were assessed by the trypan blue exclusion assay. Cells were treated as indicated with IFNγ and/or docetaxel (DT) and counted after 48 h, NT: not treated, CT: control treatment (solvent). Values represent the means of three independent experiments, and the error bars represent the SE. Statistical analysis was performed using the Student's t test. *P < 0.05, **P < 0.001 and ***P < 0.0001 (B) Cell viability analyses of PC3-siMock, PC3-siDTX3L/siARTD8, PC3-siDTX3L/siARTD9 or PC3-si ARTD9/siARTD8 double knockdown cells were assessed by the trypan blue exclusion assay. Cells were treated as indicated with IFNγ and/or docetaxel (DT) and counted after 48 h, NT: not treated, CT: control treatment (solvent). Values represent the means of three independent experiments, and the error bars represent the SE. Statistical analysis was performed using the Student's t test. *P < 0.05, **P < 0.001 and ***P < 0.0001. (C) Cell viability analyses of PC3-siMock, PC3-siDTX3L, PC3-siARTD8 and PC3-siARTD9 single knockdown cells treated in presence or absence of docetaxel (DT) (0.5 nM) with the ARTD1/2-specific inhibitors Olaparib (1 μM) and Veliparib (1 μM) or with the more ARTD7/8-specific inhibitors DPQ (7.5 μM) and TIQ-A (7.5 μM) were assessed by the trypan blue exclusion assay. Values represent the means of three independent experiments performed in triplicate, and the error bars represent the SE. Statistical analysis was performed using the Student's t test. *P < 0.05, **P < 0.001 and ***P < 0.0001.
Figure 4
Figure 4
DTX3L- and ARTD9-mediated proliferation, chemo-resistance and survival in PC3 cells is dependent on STAT1. (A-C) Cell proliferation analyses of PC3-siMock, PC3-siSTAT1, PC3-siSTAT1/siDTX3L (A), PC3-siSTAT1/siARTD8 (B), or PC3-siSTAT1/siARTD9 (C), double knockdown cells in presence or absence of IFNγ (200 U/ml) were assessed by the trypan blue exclusion assay. Relative cell proliferation and cell numbers are presented as mean from three independent experiments performed in triplicate, the error bars represent the SE. Statistical analysis was performed using the Student's t test. *P < 0.05, **P < 0.001 and ***P < 0.0001. (D) Cell viability analyses of a PC3-siMock, PC3-siSTAT1 single knockdown, and PC3-siSTAT1/siDTX3L PC3-siSTAT1/siARTD8 or PC3-siSTAT1/siARTD9 double knockdown cells were assessed by the trypan blue exclusion assay. Cells were treated as indicated with IFNγ and/or docetaxel (DT), NT: not treated, CT: control treatment (solvent). Values represent the means of three independent experiments performed in triplicates, and the error bars represent the SE. Statistical analysis was performed using the Student's t test. *P < 0.05, **P < 0.001 and ***P < 0.0001.
Figure 5
Figure 5
DTX3L and ARTD9 repress tumor suppressor IRF1 expression in mPCa cells. (A and B) Immunoblot analyses of the tumor suppressor gene product IRF1. PC3-siMock, PC3-siDTX3L (A) or PC3-siARTD9 (B) single knockdown cells were treated with or without IFNγ (200 U/ml) for 6 h and then whole cell extracts separated by SDS PAGE, blotted and subsequently probed with antibodies for ARTD9, DTX3L, IRF1, IRF7 and tubulin. The immunoblots are representative of at least three independent experiments. (C) Quantification of IRF1 levels shown in Figure  5A, B. IRF1 levels were normalized to tubulin. Values represent the means of three independent experiments. (D) Quantification of ARTD9 and DTX3L protein levels in PC3-siMock, PC3-siDTX3L and PC3-siARTD9 single knockdown, respectively, as represented in Figure  5A, B. ARTD9 and DTX3L protein levels were normalized to tubulin. Values represent the means of three independent experiments. (E) Cell proliferation analyses of PC3-CMVprom-empty-control and PC3-CMVprom-IRF1 cells were assessed in presence or absence of IFNγ (100U/ml) by the trypan blue exclusion assay. Relative cell proliferation and cell numbers are presented as means of three independent experiments performed in triplicates. (F) Cell proliferation analyses of PC3-siMock, PC3-siIRF1 and PC3-siARTD9 single knockdown cells were assessed in presence or absence of IFNγ (200 U/ml) by the trypan blue exclusion assay. Relative cell proliferation and cell numbers are presented as means of three independent experiments performed in triplicate. (G) Cell proliferation analyses of LNCaP-siMock and LNCaP-siIRF1 single knockdown cells were assessed by the trypan blue exclusion assay. Relative cell proliferation and cell numbers are presented as means of two independent experiments performed in triplicate. All error bars shown in A to G represent the SE. Statistical analysis was performed using the Student's t test. *P < 0.05, **P < 0.001 and ***P < 0.0001.
Figure 6
Figure 6
DTX3L interacts with the IFNGR complex and together with ARTD9 antagonistically regulates the phosphorylation of STAT1 on Y701 in PC3 cells. (A and B) Immunoblot analyses of STAT1-signaling in PC3-siMock, PC3-siDTX3L (A), and PC3-siARTD9 (B) single knockdown cells. PC3-siMock, PC3-siDTX3L or PC3-siARTD9 single knockdown cells were treated with or without IFNγ (200 U/ml) for 2 h and then whole cell extracts separated by SDS PAGE, blotted and subsequently probed with antibodies for STAT1, pSTAT1(Y701), pSTAT1(S727) and tubulin. The immunoblots are representative of at least three independent experiments. (C and D) Quantification of pSTAT1(Y701) and pSTAT1(S727) levels shown in Figure  5A, B. pSTAT1(Y701) and pSTAT1(S727) levels were normalized to tubulin and STAT1. Values represent the mean of three independent experiments, and the error bar represents the SE. Statistical analysis was performed using the Student's t test. *P < 0.05, **P < 0.001 and ***P < 0.0001. (E and F) Co-immunoprecipitation analyses of endogenous DTX3L-IFNGR complexes in PC3 cells: Endogenous DTX3L/IFNGR complexes were co-immunoprecipitated using an anti-DTX3L antibody. Complexes were then separated on SDS PAGE, blotted and subsequently probed with antibodies against endogenous DTX3L, ARTD9, STAT1, IFNGR1, JAK1, JAK2, PTPN1 and PTPN2.
Figure 7
Figure 7
DTX3L but not ARTD9 or ARTD8 mediates together with STAT1 cell migration of PC3 cells. (A-E) PC3-siMock, PC3-siDTX3L (A), PC3-siARTD9 (B), PC3-siARTD8 (C), PC3-siSTAT1 (D) single knockdown cells and PC3-siDTX3L/siSTAT1 (E) PC3-double knockdown cells were seeded into 6-well plates and treated as described in Material and Methods. At 0, 12, 24, and 36 h photographs were made and quantified as described in Material and Methods. Values represent the mean of three independent experiments and the error bars represent the SE. Statistical analysis was performed using the Student's t test. *P < 0.05, **P < 0.001 and ***P < 0.0001.
Figure 8
Figure 8
DTX3L-mediated cell migration of PC3 cells might also be dependent on STAT3. (A-F) PC3-siSTAT3 single knockdown cells (A), PC3-siDTX3L/siSTAT3 (B), PC3-siSTAT1/siSTAT3 (C) double knockdown cells and PC3-siDTX3L/siSTAT1/siSTAT3 (D) triple knockdown cells were seeded into 6-well plates and treated as described in Material and Methods. At 0, 12, 24, and 36 h photographs were made and quantified as described in Material and Methods. Values represent the mean of three independent experiments and the error bars represent the SE. Statistical analysis was performed using the Student's t test. *P < 0.05, **P < 0.001 and ***P < 0.0001.
Figure 9
Figure 9
Proposed working models for the postulated crosstalk among DTX3L, ARTD8 and ARTD9 in chemotherapy-resistant mPCa cells. (A) Constitutively active IL6/STAT3-signaling and enhanced IFNGR-JAK1/2-STAT1- signaling in chemotherapy-resistant mPCa cells, including CRPC-like cells causes overexpression of DTX3L and ARTD9, which in turn, further stimulates their own expression through a positive feedback loop. (B) Crosstalk between DTX3L/ARTD9-STAT1 and ARTD8-STAT6-signaling pathways is required for proliferation and cell survival of chemotherapy-resistant mPCa cells, including CRPC-like cells. (C) Similar to the situation in HR-DLBCL, DTX3L and ARTD9, together with STAT1β repress the transcriptional activation of the tumor suppressor IRF1 and other anti-proliferative and pro-apoptotic genes while together with STAT1α both, DTX3L and ARTD9 might activate genes required for cell proliferation and survival of mPCa cells. (D) Overexpression of DTX3L but not ARTD8 or ARTD9 also mediates cell migration of mPCa cells, dependent on STAT1 and STAT3-signaling. DTX3L might form migration-specific, ARTD9-independent STAT1 homodimer or non-canonical STAT1/STAT3 heterodimer complexes.

References

    1. Shen MM, Abate-Shen C. Molecular genetics of prostate cancer: new prospects for old challenges. Genes Dev. 2010;24(18):1967–2000. - PMC - PubMed
    1. Wegiel B, Evans S, Hellsten R, Otterbein LE, Bjartell A, Persson JL. Molecular pathways in the progression of hormone-independent and metastatic prostate cancer. Curr Cancer Drug Targets. 2010;10(4):392–401. - PubMed
    1. Berger MF, Lawrence MS, Demichelis F, Drier Y, Cibulskis K, Sivachenko AY, Sboner A, Esgueva R, Pflueger D, Sougnez C, Onofrio R, Carter SL, Park K, Habegger L, Ambrogio L, Fennell T, Parkin M, Saksena G, Voet D, Ramos AH, Pugh TJ, Wilkinson J, Fisher S, Winckler W, Mahan S, Ardlie K, Baldwin J, Simons JW, Kitabayashi N, MacDonald TY. et al. The genomic complexity of primary human prostate cancer. Nature. 2011;470(7333):214–220. - PMC - PubMed
    1. Cheng L, Montironi R, Bostwick DG, Lopez-Beltran A, Berney DM. Staging of prostate cancer. Histopathology. 2012;60(1):87–117. - PubMed
    1. Rubin MA, Maher CA, Chinnaiyan AM. Common gene rearrangements in prostate cancer. J Clin Oncol. 2011;29(27):3659–3668. - PMC - PubMed

Publication types

MeSH terms