

Transcriptome differences between two sister desert poplar species under salt stress
- PMID: 24886148
- PMCID: PMC4035067
- DOI: 10.1186/1471-2164-15-337
Transcriptome differences between two sister desert poplar species under salt stress
Abstract
Background: Populus euphratica Oliv and P. pruinosa Schrenk (Salicaceae) both grow in dry desert areas with high summer temperatures. However, P. euphratica is distributed in dry deserts with deep underground water whereas P. pruinosa occurs in deserts in which there is underground water close to the surface. We therefore hypothesized that these two sister species may have evolved divergent regulatory and metabolic pathways during their interaction with different salt habitats and other stresses. To test this hypothesis, we compared transcriptomes from callus exposed to 24 h of salt stress and control callus samples from both species and identified differentially expressed genes (DEGs) and alternative splicing (AS) events that had occurred under salt stress.
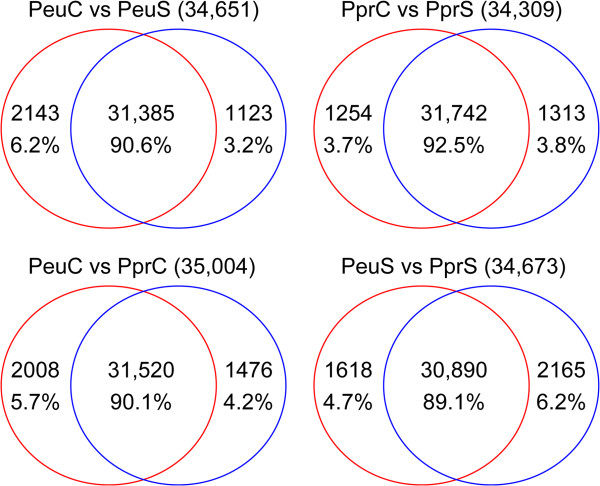
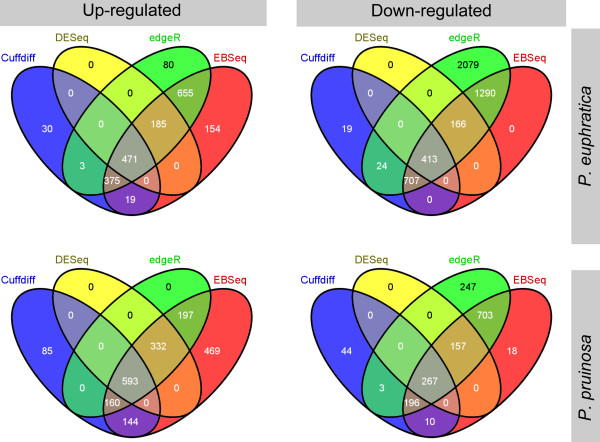
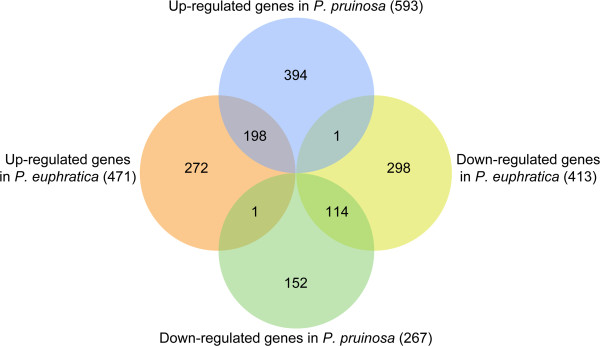
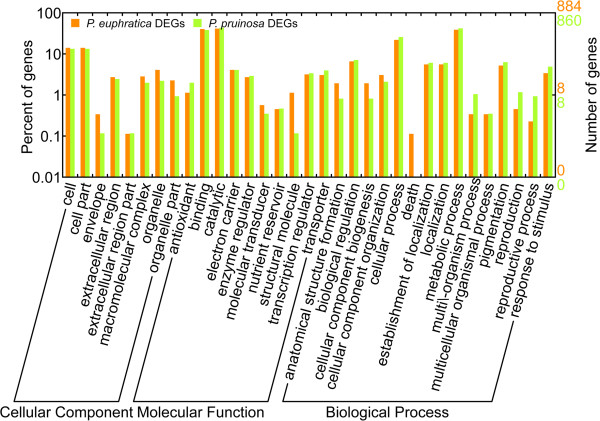
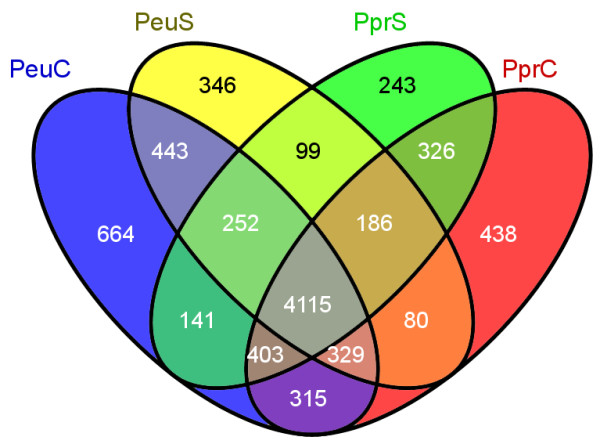
Results: A total of 36,144 transcripts were identified and 1430 genes were found to be differentially expressed in at least one species in response to salt stress. Of these DEGs, 884 and 860 were identified in P. euphratica and P. pruinosa, respectively, while 314 DEGs were common to both species. On the basis of parametric analysis of gene set enrichment, GO enrichment in P. euphratica was found to be significantly different from that in P. pruinosa. Numerous genes involved in hormone biosynthesis, transporters and transcription factors showed clear differences between the two species in response to salt stress. We also identified 26,560 AS events which were mapped to 8380 poplar genomic loci from four libraries. GO enrichments for genes undergoing AS events in P. euphratica differed significantly from those in P. pruinosa.
Conclusions: A number of salt-responsive genes in both P. euphratica and P. pruinosa were identified and candidate genes with potential roles in the salinity adaptation were proposed. Transcriptome comparisons of two sister desert poplar species under salt stress suggest that these two species may have developed different genetic pathways in order to adapt to different desert salt habitats. The DEGs that were found to be common to both species under salt stress may be especially important for future genetic improvement of cultivated poplars or other crops through transgenic approaches in order to increase tolerance of saline soil conditions.
Figures
Similar articles
-
Transcriptome dynamics of a desert poplar (Populus pruinosa) in response to continuous salinity stress.Plant Cell Rep. 2014 Sep;33(9):1565-79. doi: 10.1007/s00299-014-1638-z. Epub 2014 Jun 10. Plant Cell Rep. 2014. PMID: 24913126
-
Genome-scale transcriptome analysis of the desert poplar, Populus euphratica.Tree Physiol. 2011 Apr;31(4):452-61. doi: 10.1093/treephys/tpr015. Epub 2011 Mar 22. Tree Physiol. 2011. PMID: 21427158
-
Transcriptomic Analysis of Seed Germination Under Salt Stress in Two Desert Sister Species (Populus euphratica and P. pruinosa).Front Genet. 2019 Mar 25;10:231. doi: 10.3389/fgene.2019.00231. eCollection 2019. Front Genet. 2019. PMID: 30967895 Free PMC article.
-
Salinity tolerance of Populus.Plant Biol (Stuttg). 2010 Mar;12(2):317-33. doi: 10.1111/j.1438-8677.2009.00301.x. Plant Biol (Stuttg). 2010. PMID: 20398238 Review.
-
Genome-wide Identification of WRKY Genes in the Desert Poplar Populus euphratica and Adaptive Evolution of the Genes in Response to Salt Stress.Evol Bioinform Online. 2015 Aug 5;11(Suppl 1):47-55. doi: 10.4137/EBO.S22067. eCollection 2015. Evol Bioinform Online. 2015. PMID: 26309388 Free PMC article. Review.
Cited by
-
Genome-wide identification and expression analysis of EPF/EPFL gene family in Populus trichocarpa.Front Genet. 2024 Jul 18;15:1432376. doi: 10.3389/fgene.2024.1432376. eCollection 2024. Front Genet. 2024. PMID: 39092431 Free PMC article.
-
Transcriptome differences between fiber-type and seed-type Cannabis sativa variety exposed to salinity.Physiol Mol Biol Plants. 2016 Oct;22(4):429-443. doi: 10.1007/s12298-016-0381-z. Epub 2016 Oct 12. Physiol Mol Biol Plants. 2016. PMID: 27924117 Free PMC article.
-
The draft genome sequence of a desert tree Populus pruinosa.Gigascience. 2017 Sep 1;6(9):1-7. doi: 10.1093/gigascience/gix075. Gigascience. 2017. PMID: 28938721 Free PMC article.
-
Transcriptome analysis of the Holly mangrove Acanthus ilicifolius and its terrestrial relative, Acanthus leucostachyus, provides insights into adaptation to intertidal zones.BMC Genomics. 2015 Aug 14;16(1):605. doi: 10.1186/s12864-015-1813-9. BMC Genomics. 2015. PMID: 26272068 Free PMC article.
-
Rapidly evolving genetic features for desert adaptations in Stipagrostis pennata.BMC Genomics. 2021 Nov 23;22(1):846. doi: 10.1186/s12864-021-08124-w. BMC Genomics. 2021. PMID: 34814836 Free PMC article.
References
Publication types
MeSH terms
Substances
LinkOut - more resources
Full Text Sources
Other Literature Sources
Research Materials
