. 2014 May 29:7:41.
doi: 10.1186/1756-6606-7-41.

Transcriptomic evidence for immaturity of the prefrontal cortex in patients with schizophrenia

Affiliations

Transcriptomic evidence for immaturity of the prefrontal cortex in patients with schizophrenia

Hideo Hagihara et al. Mol Brain. .

Abstract

Background: Schizophrenia, a severe psychiatric disorder, has a lifetime prevalence of 1%. The exact mechanisms underlying this disorder remain unknown, though theories abound. Recent studies suggest that particular cell types and biological processes in the schizophrenic cortex have a pseudo-immature status in which the molecular properties partially resemble those in the normal immature brain. However, genome-wide gene expression patterns in the brains of patients with schizophrenia and those of normal infants have not been directly compared. Here, we show that the gene expression patterns in the schizophrenic prefrontal cortex (PFC) resemble those in the juvenile PFC.

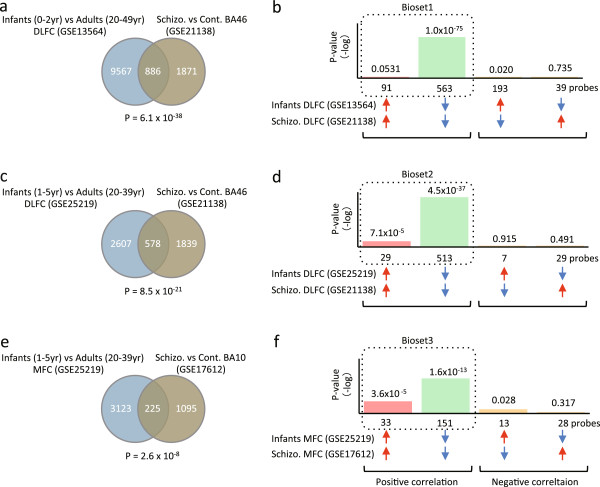
Results: We conducted a gene expression meta-analysis in which, using microarray data derived from different studies, altered expression patterns in the dorsolateral PFC (DLFC) of patients with schizophrenia were compared with those in the DLFC of developing normal human brains, revealing a striking similarity. The results were replicated in a second DLFC data set and a medial PFC (MFC) data set. We also found that about half of the genes representing the transcriptomic immaturity of the schizophrenic PFC were developmentally regulated in fast-spiking interneurons, astrocytes, and oligodendrocytes. Furthermore, to test whether medications, which often confound the results of postmortem analyses, affect on the juvenile-like gene expressions in the schizophrenic PFC, we compared the gene expression patterns showing transcriptomic immaturity in the schizophrenic PFC with those in the PFC of rodents treated with antipsychotic drugs. The results showed no apparent similarities between the two conditions, suggesting that the juvenile-like gene expression patterns observed in the schizophrenic PFC could not be accounted for by medication effects. Moreover, the developing human PFC showed a gene expression pattern similar to that of the PFC of naive Schnurri-2 knockout mice, an animal model of schizophrenia with good face and construct validity. This result also supports the idea that the transcriptomic immaturity of the schizophrenic PFC is not due to medication effects.

Conclusions: Collectively, our results provide evidence that pseudo-immaturity of the PFC resembling juvenile PFC may be an endophenotype of schizophrenia.


Figures

Figure 1
Figure 1
Comparison of gene expression patterns between the developing and adult schizophrenic prefrontal cortex (PFC). (a) The gene expression pattern in the dorsolateral frontal cortex (DLFC; Brodmann area [BA]46) of patients with schizophrenia (GSE21138, patients [26.1 ± 2.05 years] compared with controls [28.8 ± 2.55 years]) was compared with that in the DLFC (BA46) of normal infants (GSE13564, infants <2 years, compared to adults, 20–49 years). (b) The gene expression pattern in the DLFC (BA46) of patients with schizophrenia (GSE21138, patients compared with controls) was compared with that in the DLFC (BA9 and 46) of normal infants (GSE25219, infants, 1–5 years, compared with adults, 20–39 years). Note that microarray data sets of the normal developing DLFC were obtained from two independent research groups and were used in (a) and (b), respectively. (c) The gene expression pattern in the medial prefrontal cortex, (MFC) (BA10) of patients with schizophrenia (GSE17612, patients [73.3 ± 15.2 years] compared with controls [69.0 ± 21.6 years]) was compared with that in the MFC (BA24, 32, 33) of normal infants (GSE25219, infants, 1–5 years, compared with adults, 20–39 years).
Figure 2
Figure 2
Transcriptional immaturity of PFC in the schizophrenic brain. (a, c, e) Venn diagrams illustrating the overlap in transcriptome-wide gene expression changes in the DLFC (BA46) of patients with schizophrenia (patients compared with controls) and normal infants (infants <2 years, compared with adults, 20–49 years) (a), the DLFC (BA46) of patients with schizophrenia (patients compared with controls) and that in the DLFC (BA9 and 46) of normal infants (infants, 1–5 years, compared with adults, 20–39 years) (c), and the MFC (BA10) of patients with schizophrenia (patients compared with controls) and that in the MFC (BA24, 32, 33) of normal infants (infants, 1–5 years, compared with adults, 20–39 years) (e). (b, d, f)P-values of overlap between the schizophrenic DLFC and normal developing DLFC (<2 years compared with 20–49 years) data sets (b), schizophrenic DLFC and normal developing DLFC (1–5 years compared with 20–39 years) data sets (d), and schizophrenic MFC and normal developing MFC (1–5 years, compared with 20–39 years) data sets (f). Bar graphs illustrate the P-values of overlaps of genes upregulated (red arrows) or downregulated (blue arrows) by each condition, between the two conditions. Bonferroni correction was used to adjust the significant level by the number of pairs of datasets included in each study (see the Methods section and Additional file 1: Table S27). The genes that showed the same directional changes in expression, or positive correlation, between two groups in (b), (d), and (f) were designated Bioset1–3 (surrounded by dotted line), respectively. These Biosets were used in the analyses for pathway enrichment (Additional file 1: Table S6, S7, S9) and cell-type contribution (Figure  3).
Figure 3
Figure 3
Cell-type contributions to transcriptional immaturity in schizophrenic PFC. Genes showing the same directional changes in expression between the normal developing and adult schizophrenic PFC (a-d, Bioset1 in DLFC data set; e-h, Bioset2 in second DLFC data set; i-l, Bioset3 in MFC data set) were compared to those obtained from cell-type specific developmental experiments (a, e, i, FS neurons [GSE17806]; b, f, j, astrocytes [GSE9566]; c, g, k, oligodendrocytes [GSE9566]). Venn diagrams illustrate the overlap in transcriptome-wide gene expression changes between two conditions. Bonferroni correction was used to adjust the significant level by the number of pairs of datasets included in each study (see the Methods section and Additional file 1: Table S27). Bar graphs illustrate the P-values of overlaps of genes upregulated (red arrows) or downregulated (blue arrows) by each condition, between the two conditions. Note that the scale of the y-axis is the same in a–c, e–g, and i–k. (d, h, l) Pie chart representing the percentage that each cell-type contributes to altered gene expression in Bioset1 (d), Bioset2 (h), and Bioset3 (l). Ast, astrocytes; FS, FS neurons; OL, oligodendrocytes.
Figure 4
Figure 4
Transcriptional immaturity of PFC in an animal model of schizophrenia. (a) Venn diagram illustrating the overlap in transcriptome-wide gene expression changes in the MFC of Shn-2 KO mice (Shn-2 KO compared to wild type) and that in human infants (GSE25219; infants, 1–5 years, compared with adults, 20–39 years). (b)P-values of overlap between Shn-2 KO mouse and human infant data sets. Bar graph illustrates the P-values of overlaps of genes upregulated (red arrows) or downregulated (blue arrows) by each condition, between the two conditions. The genes that showed the same directional changes in expression, or positive correlation, between two groups were designated Bioset4. (c–e) Comparison of gene expression derived from cell-type specific developmental experiments (c, FS neurons [GSE17806]; (d), astrocytes [GSE9566]; (e), oligodendrocytes [GSE9566]) with Bioset4. Bonferroni correction was used to adjust the significant level by the number of pairs of datasets included in each study (see the Methods section and Additional file 1: Table S27). (f) Pie chart representing the percentage that a particular cell type contributes to the altered gene expression pattern in Bioset4.

References

    1. Purcell SM, Wray NR, Stone JL, Visscher PM, O’Donovan MC, Sullivan PF, Sklar P. Common polygenic variation contributes to risk of schizophrenia and bipolar disorder. Nature. 2009;460:748–752. - PMC - PubMed
    1. Ripke S, O’Dushlaine C, Chambert K, Moran JL, Kähler AK, Akterin S, Bergen SE, Collins AL, Crowley JJ, Fromer M, Kim Y, Lee SH, Magnusson PKE, Sanchez N, Stahl EA, Williams S, Wray NR, Xia K, Bettella F, Borglum AD, Bulik-Sullivan BK, Cormican P, Craddock N, de Leeuw C, Durmishi N, Gill M, Golimbet V, Hamshere ML, Holmans P, Hougaard DM. et al.Genome-wide association analysis identifies 13 new risk loci for schizophrenia. Nat Genet. 2013;45:1150–1159. doi: 10.1038/ng.2742. - DOI - PMC - PubMed
    1. Ripke S, Sanders AR, Kendler KS, Levinson DF, Sklar P, Holmans PA, Lin DY, Duan J, Ophoff RA, Andreassen OA, Scolnick E, Cichon S, St Clair D, Corvin A, Gurling H, Werge T, Rujescu D, Blackwood DH, Pato CN, Malhotra AK, Purcell S, Dudbridge F, Neale BM, Rossin L, Visscher PM, Posthuma D, Ruderfer DM, Fanous A, Stefansson H, Steinberg S. et al.Genome-wide association study identifies five new schizophrenia loci. Nat Genet. 2011;43:969–976. doi: 10.1038/ng.940. - DOI - PMC - PubMed
    1. Stefansson H, Ophoff RA, Steinberg S, Andreassen OA, Cichon S, Rujescu D, Werge T, Pietiläinen OP, Mors O, Mortensen PB, Sigurdsson E, Gustafsson O, Nyegaard M, Tuulio­Henriksson A, Ingason A, Hansen T, Suvisaari J, Lonnqvist J, Paunio T, Børglum AD, Hartmann A, Fink­Jensen A, Nordentoft M, Hougaard D, Norgaard­Pedersen B, Böttcher Y, Olesen J, Breuer R, Möller HJ, Giegling I. et al.Common variants conferring risk of schizophrenia. Nature. 2009;460:744–747. - PMC - PubMed
    1. Gandal MJ, Nesbitt AM, McCurdy RM, Alter MD. Measuring the maturity of the fast-spiking interneuron transcriptional program in autism, schizophrenia, and bipolar disorder. PLoS One. 2012;7:e41215. doi: 10.1371/journal.pone.0041215. - DOI - PMC - PubMed

Publication types

MeSH terms

Substances