. 2014 May 28:14:375.
doi: 10.1186/1471-2407-14-375.

Thrombomodulin expression regulates tumorigenesis in bladder cancer

Affiliations

Thrombomodulin expression regulates tumorigenesis in bladder cancer

Chun-Te Wu et al. BMC Cancer. .

Abstract

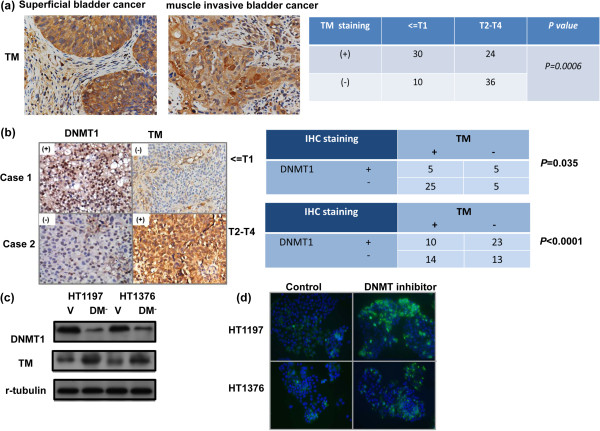
Background: The identification of potential tumor markers will help improve therapeutic planning and patient management. Thrombomodulin (TM) is a sensitive urothelial marker. TM was reported to be one of the endogenous anti-metastatic factors and has diagnostic and prognostic values for the progression of carcinoma. In the present study, we examine the role of TM in bladder cancer.

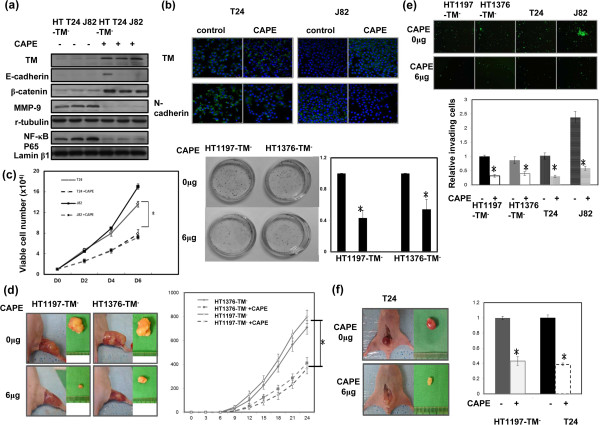
Methods: We studied the role of TM in tumor behavior and related signaling pathways in vitro using the human bladder cancer cell lines HT1376, HT1197, J82 and T24, and in vivo using animal models. We also selected clinical specimens from 100 patients with bladder cancer for immunohistochemical staining to evaluate the predictive capacity of TM in tumor invasiveness.

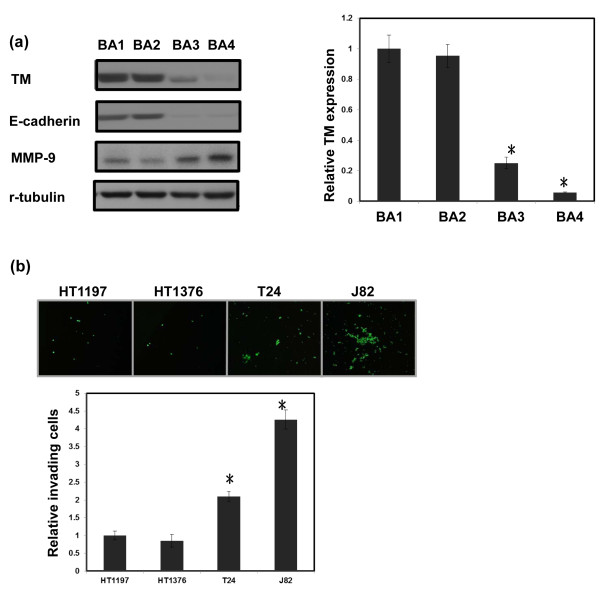
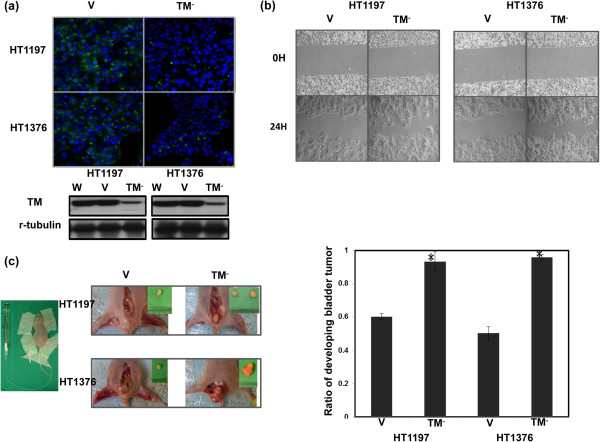
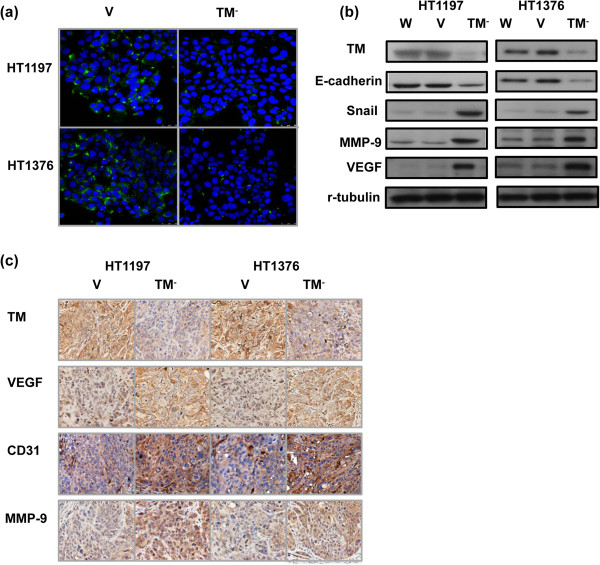
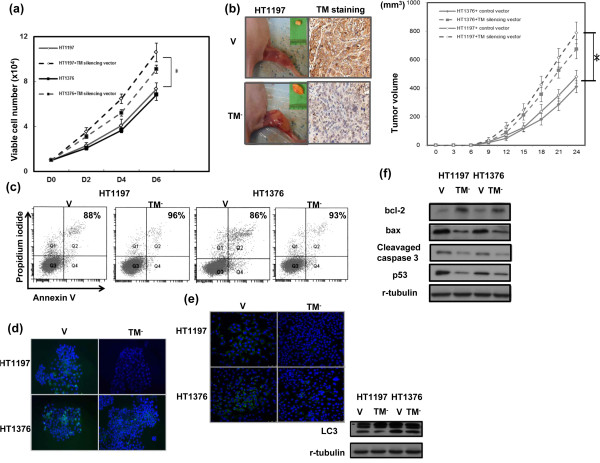
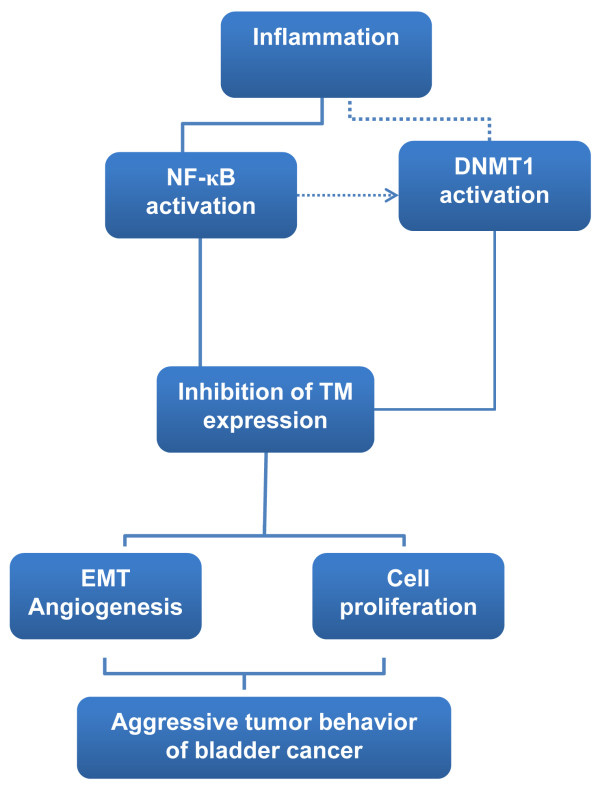
Results: The data revealed that positive immunoreactivity for TM was inversely correlated with clinical stage and DNA methyltransferase 1 immunoreactivity. Decreased TM expression could predict the aggressive tumor growth and advanced clinical stage in bladder cancer. When TM was inhibited, tumor growth rate and invasion ability were augmented in vitro and in vivo. The underlying changes included increased cell proliferation, enhanced epithelial-mesenchymal transition (EMT) and angiogenesis. Moreover, inhibition of NF-κB activation significantly increased TM expression and attenuated tumor aggressiveness in bladder cancer.

Conclusions: TM plays an important role in bladder cancer tumor aggressiveness in vitro and in vivo and is a clinically significant predictor that may represent a suitable therapeutic target for bladder cancer.


Figures

Figure 1
Figure 1
Levels of TM in bladder cancer cell lines. (a) Levels of TM were examined in HT1197, HT1376, T24 and J82 cell lines using RT-PCR and Western blot analyses. For real-time RT-PCR analysis, the y-axis represents the ratio of TM expression in four cancer cell lines relative to the expression in HT1197 cancer cells. (b) The invasive capacity of bladder cancer cells was evaluated by invasion assays. The results from representative slides are shown. The y-axis represents the ratio of invading cells detected in four bladder cancer cell lines normalized to that in HT1197 cancer cells. Data are expressed as the mean of three separate experiments ± SD; *P  <  0.05. (BA1 = HT1197; BA2 = HT1376; BA3 = T24; BA4 = J82).
Figure 2
Figure 2
Role of TM in tumor invasiveness. (a) IF and Western blot analyses demonstrated the effects of the TM silencing vector on TM expression in HT1197 and HT1376 cells. Representative micrographs are shown (DAPI = blue; TM = green). TM levels were significantly decreased by the TM silencing vector compared with the control vector (CV). (b) The invasive capacity of bladder cancer cells expressing the TM silencing vector or CV was evaluated by migration scratch assays. The results from representative slides are shown. (c) The invasive capacity of bladder cancer cells was evaluated using murine orthotopic tumor implantation. The representative slides and quantitative data are shown. The y-axis represents the ratio of mice presenting intravesicular tumors normalized to that received orthotopic tumor implantation. The TM silencing vector increased the rate of tumor implantation in the bladder and was associated with larger tumor size. Data are expressed as the mean of three separate experiments ± SD; * P  <  0.05.
Figure 3
Figure 3
Role of TM in EMT changes. (a) Changes in E-cadherin expression were evaluated, and the representative micrographs are shown (DAPI = blue; E-cadherin = green). (b) Change in EMT-associated proteins in cells transfected with the TM silencing (TM-) or control vectors (CV). (c) Changes in VEGF, MMP-9, and CD31 expression in tumor xenografts were evaluated by IHC staining. The results from representative slides are shown.
Figure 4
Figure 4
Role of TM in tumor growth. (a) Effects of the TM silencing vector on the proliferation rates of HT1197 and HT1376 cancer cells. The number of viable cells was counted after incubation for 2, 4, and 6 days. The y-axis represents the viable cell number. (b) Effects of TM inhibition on xenograft tumor growth. Each point represents the mean of three separate experiments ± SD; *, P  <  0.05. Expression of TM was also evaluated by immunohistochemical staining of xenografts. Representative slides are shown at × 400 magnification. (c) Flow cytometry using annexin V-propidium iodide (PI) staining for cell death rates in cells transfected with the TM silencing vector or control vector (CV). (d) Effect of TM silencing vector on apoptosis demonstrated by IF analysis. The results from representative slides are shown (DAPI = blue; cleaved caspase 3 = green). (e) Effect of TM silencing vector on autophagy demonstrated by IF analysis. The results from representative slides are shown (DAPI = blue; LC3 = green). The level of LC3 II was also examined by Western blot analysis in cells transfected with the CV or the TM silencing vector (TM-). (f) Effects of the TM silencing vector on the expression of apoptosis- and cell aging-related proteins evaluated by Western blot. Data points represent the mean of three separate experiments ± SD. *, P  <  0.05.
Figure 5
Figure 5
Level of TM in bladder cancer. (a) Immunohistochemical staining with anti-TM antibody on human bladder cancer specimens. Representative slides demonstrate that tumor cells showed TM-positive staining and that TM levels negatively correlated with clinical stage. (b) TM levels were negatively correlated with DNMT1 expression in human bladder cancer specimens (P  <  0.05). Representative slides of two selected tumor specimens demonstrating staining for both TM and DNMT1 are shown. (c) The effect of DNMT1 inhibition on the level of TM was examined by Western blots in cells transfected with the control vector (CV) and in cells transfected with the DNMT1 silencing vector (DM-). (d) Effect of DNMT inhibition on the level of TM was examined by IF analysis. The results from representative slides are shown (DAPI = blue; TM = green).
Figure 6
Figure 6
Effects of CAPE on bladder cancer cells with lower TM expression. (a) The effect of CAPE treatment on the level of TM, NF-κB activation and EMT-related changes was examined by Western blot using cells with lower TM expression in the presence or absence of 6 μg/ml CAPE for 48 h. (b) Effect of CAPE treatment on the level of N-cadherin was examined by IF analysis in cells with lower TM expression in the presence or absence of 6 μg/ml CAPE for 48 h. The results from representative slides are shown (DAPI = blue; N-cadherin = green). (c) Effects of CAPE on the proliferation rates of T24 and J82 cell lines were evaluated by viable cell counting and by colony formation in HT1197 and HT1376 cells with inhibited TM expression. (d) Effects of CAPE treatment on xenograft tumor growth. (e) Effects of CAPE treatment on the invasive capacity of bladder cancer cells expressing the TM silencing vector was evaluated by invasion assays. The results from representative slides are shown. (f) The invasive capacity of bladder cancer cells with or without CAPE treatment was evaluated by murine orthotopic tumor implantation. Representative slides and quantitative data are shown. Data are expressed as the mean of three separate experiments ± SD; * P  <  0.05.
Figure 7
Figure 7
TM signaling pathway in bladder cancer.

References

    1. Dinney CP, McConkey DJ, Millikan RE, Wu X, Bar-Eli M, Adam L, Kamat AM, Siefker-Radtke AO, Tuziak T, Sabichi AL, Grossman HB, Benedict WF, Czerniak B. Focus on bladder cancer. Cancer Cell. 2004;6:111–116. doi: 10.1016/j.ccr.2004.08.002. - DOI - PubMed
    1. Amling CL. Diagnosis and management of superficial bladder cancer. Curr Probl Cancer. 2001;25:219–278. - PubMed
    1. Abogunrin F, O'Kane HF, Ruddock MW, Stevenson M, Reid CN, O'Sullivan JM, Anderson NH, O'Rourke D, Duggan B, Lamont JV, Boyd RE, Hamilton P, Nambirajan T, Williamson KE. The impact of biomarkers in multivariate algorithms for bladder cancer diagnosis in patients with hematuria. Cancer. 2012;118:2641–2650. doi: 10.1002/cncr.26544. - DOI - PubMed
    1. Esmon CT. The regulation of natural anticoagulant pathways. Science. 1987;235:1348–1352. doi: 10.1126/science.3029867. - DOI - PubMed
    1. Kao YC, Wu LW, Shi CS, Chu CH, Huang CW, Kuo CP, Sheu HM, Shi GY, Wu HL. Downregulation of thrombomodulin, a novel target of Snail, induces tumorigenesis through epithelial-mesenchymal transition. Mol Cell Biol. 2010;30:4767–4785. doi: 10.1128/MCB.01021-09. - DOI - PMC - PubMed

Publication types