. 2014 May 16:11:92.
doi: 10.1186/1743-422X-11-92.

Functional properties of the HIV-1 long terminal repeat containing single-nucleotide polymorphisms in Sp site III and CCAAT/enhancer binding protein site I

Affiliations

Functional properties of the HIV-1 long terminal repeat containing single-nucleotide polymorphisms in Sp site III and CCAAT/enhancer binding protein site I

Sonia Shah et al. Virol J. .

Abstract

Background: HIV-1 gene expression is driven by the long terminal repeat (LTR), which contains many binding sites shown to interact with an array of host and viral factors. Selective pressures within the host as well as the low fidelity of reverse transcriptase lead to changes in the relative prevalence of genetic variants within the HIV-1 genome, including the LTR, resulting in viral quasispecies that can be differentially regulated and can potentially establish niches within specific cell types and tissues.

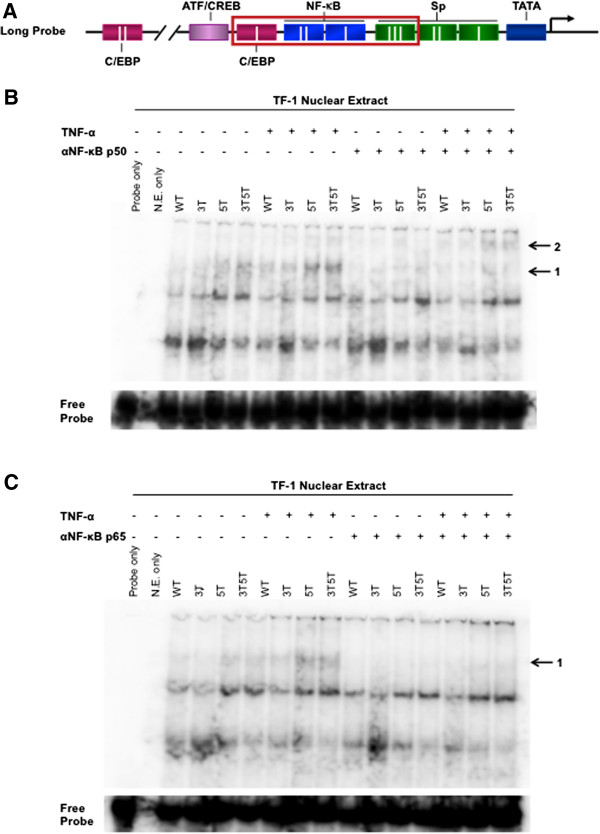
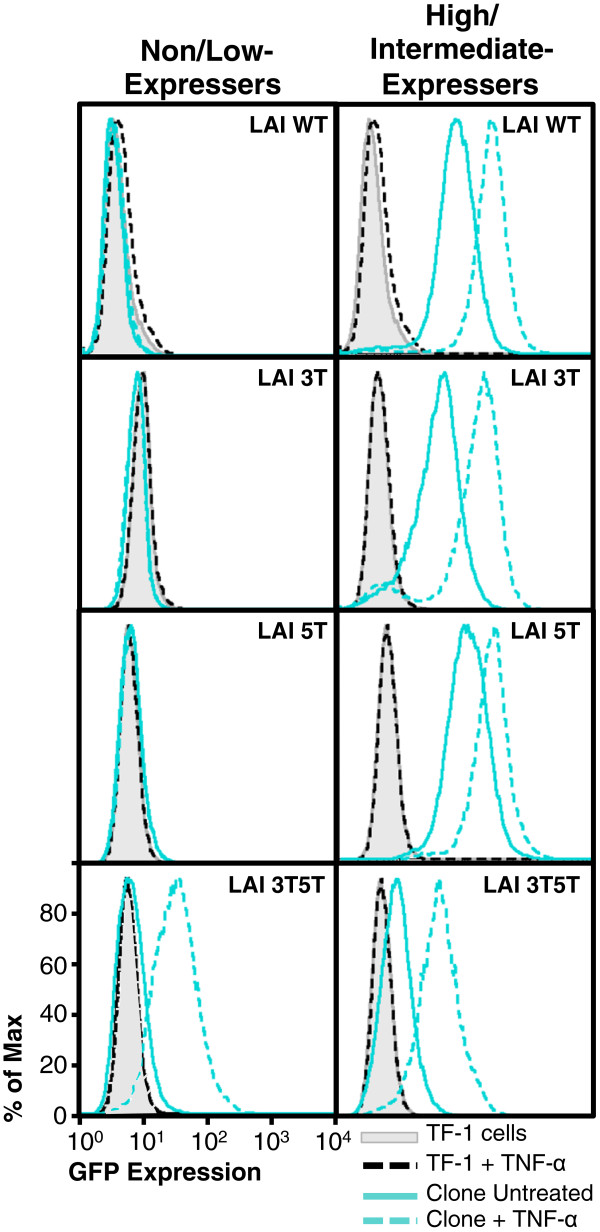
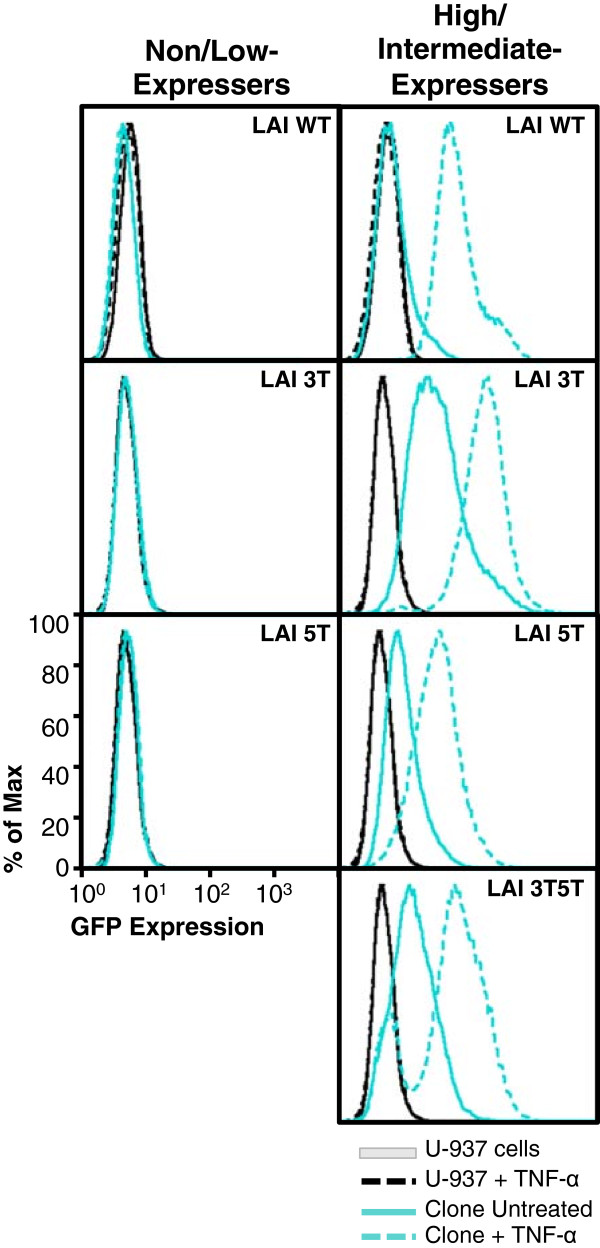
Methods: Utilizing flow cytometry and electromobility shift assays, specific single-nucleotide sequence polymorphisms (SNPs) were shown to alter both the phenotype of LTR-driven transcription and reactivation. Additional studies also demonstrated differential loading of transcription factors to probes derived from the double-variant LTR as compared to probes from the wild type.

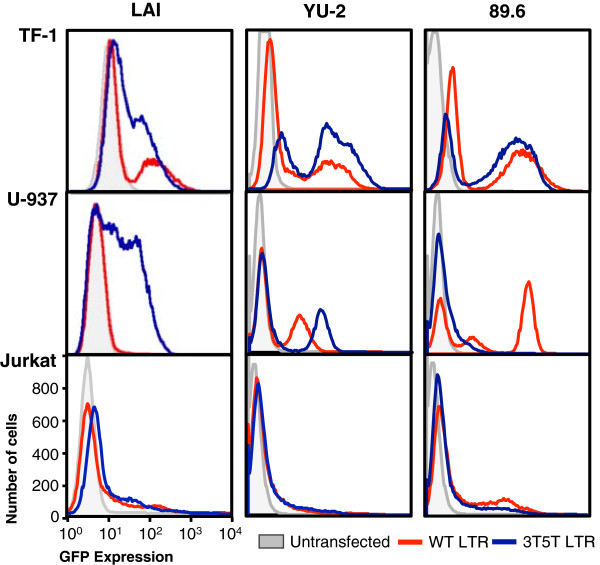
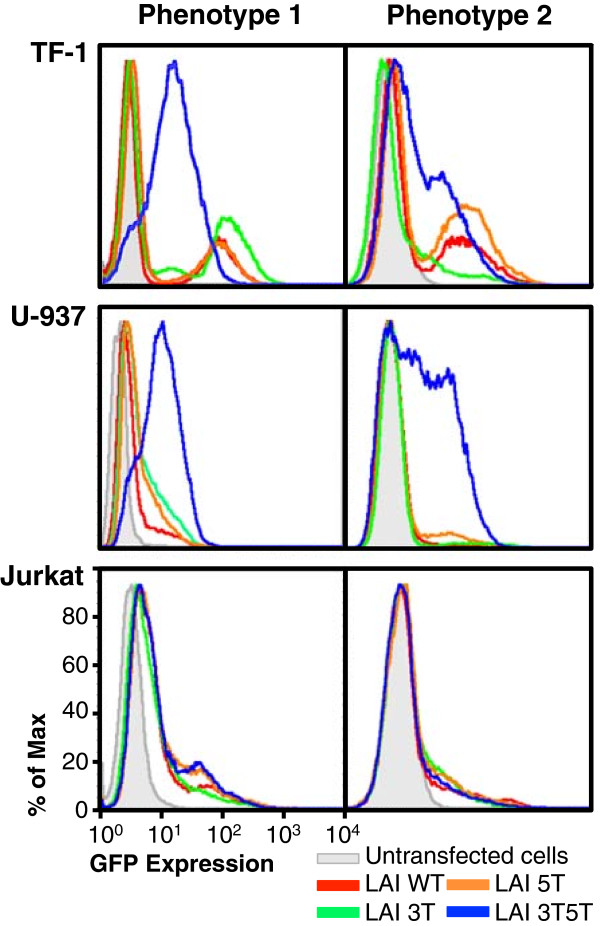
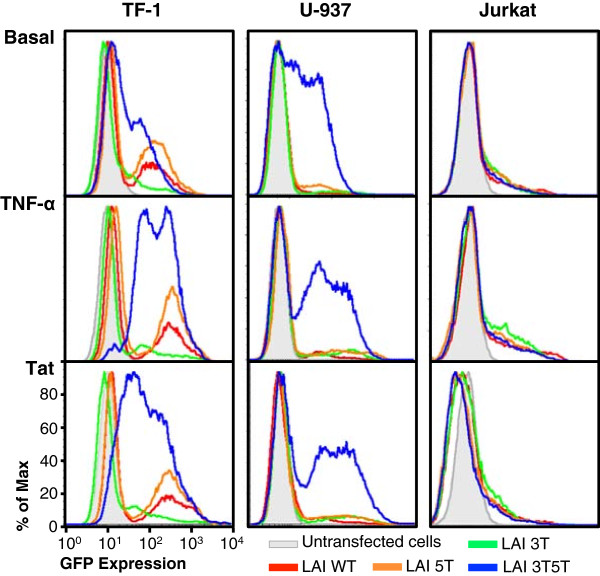
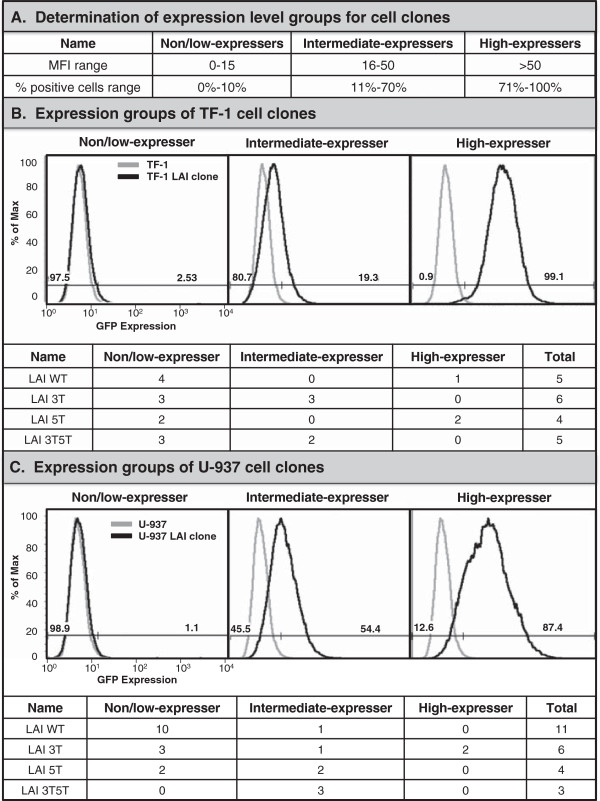
Results: This study has identified specific SNPs within CCAAT/enhancer binding protein (C/EBP) site I and Sp site III (3 T, C-to-T change at position 3, and 5 T, C-to-T change at position 5 of the binding site, respectively) that alter LTR-driven gene transcription and may alter the course of viral latency and reactivation. The HIV-1 LAI LTRs containing the SNPs of interest were coupled to a plasmid encoding green fluorescent protein (GFP), and polyclonal HIV-1 LTR-GFP stable cell lines utilizing bone marrow progenitor, T, and monocytic cell lines were constructed and utilized to explore the LTR phenotype associated with these genotypic changes.

Conclusions: Although the 3 T and 5 T SNPs have been shown to be low-affinity binding sites, the fact that they can still result in effective HIV-1 LTR-driven gene expression, particularly within the TF-1 cell line, has suggested that the low binding site affinities associated with the 3 T C/EBP site I and 5 T Sp site III are potentially compensated for by the interaction of nuclear factor-κB with its corresponding binding sites under selected physiological and cellular conditions. Additionally, tumor necrosis factor-α and Tat can enhance basal transcription of each SNP-specific HIV-1 LTR; however, differential regulation of the LTR is both SNP- and cell type-specific.


Figures

Figure 1
Figure 1
Parental (wild-type; WT) and 3T5T long terminal repeat (LTR) results in cell type–specific phenotypes within different promoter backbones. TF-1, U-937, and Jurkat cells were stably transfected with the HIV-1 LAI, YU-2, and 89.6 LTRs, which were placed in a green fluorescent protein expression vector (pEGFP-N1) using the AMAXA Nucleofector System (Lonza, Basel, Switzerland). Mutagenesis was used to introduce the position 3 C-to-T change at CCAAT/enhancer binding protein (C/EBP) site I and a position 5 C-to-T change at Sp site III (3T5T). Flow cytometric analysis was used to measure the ability of the variant LTR to drive GFP expression as compared with their parental (WT) counterparts. The fluorescence patterns in untransfected cells are depicted in gray. The LAI WT LTR is shown in red and the LAI 3T5T LTR is shown in blue.
Figure 2
Figure 2
Cell populations independently recovered from low-temperature storage resulted in two general phenotypes with respect to HIV-1 3T5T long terminal repeat–green fluorescent protein (LTR-GFP) basal expression. TF-1, U-937, and Jurkat cells were stably transfected with the HIV-1 LAI LTR, which was placed in a GFP expression vector (pEGFP-N1) using the AMAXA Nucleofector System (Lonza, Basel, Switzerland). Mutagenesis was used to introduce the position 3 C-to-T change at CCAAT/enhancer binding protein (C/EBP) site I (3 T), a position 5 C-to-T change at Sp site III (5 T), or to introduce both the 3 T and 5 T variants into the same LAI LTR (3T5T). Flow cytometric analysis was used to measure the ability of each LTR to drive GFP expression as compared with their parental (WT) counterparts. The fluorescence patterns in untransfected cells are depicted in gray. The LAI WT LTR is shown in red; LAI 3 T LTR in green; LAI 5 T LTR in orange; and the HIV-1 LAI 3T5T LTR in blue. Phenotype expression pattern 1 is shown by panels on the left, while the phenotype expression pattern 2 is shown by panels one the right. All cells were analyzed by flow cytometry for basal levels of LTR-driven GFP expression between passages 6 and 8.
Figure 3
Figure 3
Double-variant 3T5T long terminal repeat (LTR) results in altered gene expression in the stably transfected cell lines. U-937 cells were stably transfected with the LAI LTR, cloned within the context of the green fluorescent protein expression vector pEGFP-N1 using the AMAXA Nucleofector System (Lonza, Basel, Switzerland). Mutagenesis was performed to introduce the position 3 C-to-T change at CCAAT/enhancer binding protein (C/EBP) site I (3 T), a position 5 C-to-T change at Sp site III (5 T), or to introduce both the 3 T and 5 T mutations into a single LTR (3T5T). Flow cytometric analysis was used to measure the ability of each LTR to drive GFP expression as compared with their parental (WT) counterparts. Untransfected cells are depicted in gray. The LAI WT LTR is shown in red; LAI 3 T LTR in green; LAI 5 T LTR in orange, and the LAI 3T5T LTR in blue. Under basal conditions, cells expressing the 3T5T LTR expressed an intermediate level of GFP when compared with WT and the other variants that mainly had low GFP expression. Stably transfected cells were treated with TNF-α (20 ng/mL) for 24 hours and then GFP expression was assessed using flow cytometry. The cells expressing the 3T5T LTR resulted in an increase in the high-GFP-expressing population. In addition, cells expressing GFP driven by the 3 T LTR showed a great increase in high-GFP-expressing cells. Stably transfected cells were transfected with Tat86 (300 ng) using the AMAXA Nucleofector System. Tat stimulation of the LTRs was shown to drive a very high level of GFP expression in the 3T5T LTR-GFP-expressing cells, and a small increase in intermediate/high-GFP-expressing cells when driven by the 3 T LTR.
Figure 4
Figure 4
Nuclear factor-κB (NF-κB) p50 and p65 bind more efficiently to the 5 T and 3T5T long terminal repeats (LTRs). Nuclear extract was isolated from normal and tumor necrosis factor-α (TNF-α)-treated TF-1 cells. (A) An LAI long probe covering CCAAT/enhancer binding protein (C/EBP) site I, NF-κB site II, NF-κB site I, and Sp site III with the wild-type (WT), 3 T, 5 T, or 3T5T single-nucleotide polymorphisms (SNPs) was used to determine differences in complex formation at each LTR. TF-1 nuclear extract was incubated with probe in the absence or presence of (B) NF-κB p50 or (C) p65 gel shift antibodies for 30 minutes. (B) Normal and activated extracts incubated with the 5 T and 3T5T long probe showed greater complex formation and abrogation and shift of complex formation when incubated with NF-κB p50 antibody (black arrows). (C) Normal and activated extracts incubated with the 5 T and 3T5T long probe showed greater complex formation and abrogation of complex formation when incubated with NF-κB p65 antibody (black arrow).
Figure 5
Figure 5
Cell clones developed from total populations of stably transfected TF-1 and U-937 cell lines reflect the green fluorescent protein (GFP) expression profile of the parental populations. The TF-1 and U-937 cells that were stably transfected with the LAI long terminal repeats (LTR) (wild-type [WT], 3 T, 5 T, and 3T5T) were serially diluted in order to obtain 1 cell in 1 mL of media (approximately 1 cell in 10 wells of a 96-well plate). Cell clone populations were propagated from a single cell and then were analyzed using flow cytometry for their basal GFP expression. The clonal populations were then designated in one of three categories (nonexpresser, intermediate expresser, and high expresser) based on their geometric mean fluorescence intensity (MFI) and their percent cell positive values (A). Representative histograms showing levels of GFP expression by the stably transfected cell clone (black line) compared with the untransfected control cell line (gray line) for TF-1 (B), U-937 (C), cell clones expressing the LAI WT, 3 T, 5 T, or 3T5T LTRs. The histograms show that the TF-1 and U-937 cell clones mimic their parental population counterparts in terms of basal GFP expression profiles. Tables below each set of histograms show the total number of clonal cell populations for each LTR genotype that falls within one of the three expression phenotypes.
Figure 6
Figure 6
Nonexpressing TF-1 cell clones containing the 3T5T LAI long terminal repeat (LTR) could be induced into LTR-driven green fluorescent protein (GFP) expression. TF-1 cells stably transfected with the HIV-1 LAI LTR (wild type [WT], 3 T, 5 T, and 3T5T) were serially diluted in order to obtain 1 cell in 1 mL of media (approximately 1 cell in 10 wells of a 96-well plate). Cell clone populations were propagated from the single cell and then were analyzed using flow cytometry for their basal GFP expression. The clonal populations were then designated in one of three categories (nonexpresser, intermediate expresser, and high expresser) based on their geometric mean fluorescence intensity (MFI) and their percent cell positive values (Figure 5A). Non/low-expressing and high-expressing LAI WT and LAI 5 T LTR containing clones were treated with a range of tumor necrosis factor-α (TNF-α) concentrations (20–300 ng/mL). Representative histograms (at a TNF-α concentration of 20 ng/mL) showing levels of GFP expression obtained with the untreated, stably transfected cell clone (solid turquoise line) compared with the treated, stably transfected cell clone (dashed turquoise line), untreated WT TF-1 cells (solid black line), and treated WT TF-1 cells (dashed black line). Each clone shown is a representative of the group.
Figure 7
Figure 7
U-937 cell clones containing nonexpressing wild-type (WT) and variant long terminal repeats (LTRs) cannot be induced into driving green fluorescent protein (GFP) expression. U-937 cells stably transfected with the LAI LTR (WT, 3 T, 5 T, and 3T5T) were serially diluted in order to obtain 1 cell in 1 mL of media (approximately 1 cell in 10 wells of a 96-well plate). Cell clone populations were propagated from the single cell and then were analyzed using flow cytometry for their basal GFP expression. The clonal populations were then designated in one of three categories (nonexpresser, intermediate expresser, and high expresser) based on their geometric mean fluorescence intensity (MFI) and their percent cell positive values (Figure 5A). Nonexpressing and expressing cell clones were treated with a range of tumor necrosis factor-α (TNF-α) concentrations (20–300 ng/mL). Representative histograms (at a TNF-α concentration of 20 ng/mL) showing levels of GFP expression obtained with the untreated, stably transfected cell clone (solid turquoise line) compared with the treated, stably transfected cell clone (dashed turquoise line), untreated WT U-937 cells (solid black line), and treated WT U-937 cells (dashed black line). As there were no nonexpressing U-937 3T5T LTRs containing clones, they are excluded from the non/low-expressing cell clone column. Each clone shown is a representative of the group.

Similar articles

Cited by

References

    1. Han Y, Wind-Rotolo M, Yang HC, Siliciano JD, Siliciano RF. Experimental approaches to the study of HIV-1 latency. Nat Rev Microbiol. 2007;5:95–106. doi: 10.1038/nrmicro1580. - DOI - PubMed
    1. Marcello A. Latency: the hidden HIV-1 challenge. Retrovirology. 2006;3:7. doi: 10.1186/1742-4690-3-7. - DOI - PMC - PubMed
    1. Ho DD, Neumann AU, Perelson AS, Chen W, Leonard JM, Markowitz M. Rapid turnover of plasma virions and CD4 lymphocytes in HIV-1 infection. Nature. 1995;373:123–126. doi: 10.1038/373123a0. - DOI - PubMed
    1. Zack JA, Arrigo SJ, Weitsman SR, Go AS, Haislip A, Chen IS. HIV-1 entry into quiescent primary lymphocytes: molecular analysis reveals a labile, latent viral structure. Cell. 1990;61:213–222. doi: 10.1016/0092-8674(90)90802-L. - DOI - PubMed
    1. McElrath MJ, Pruett JE, Cohn ZA. Mononuclear phagocytes of blood and bone marrow: comparative roles as viral reservoirs in human immunodeficiency virus type 1 infections. Proc Natl Acad Sci U S A. 1989;86:675–679. doi: 10.1073/pnas.86.2.675. - DOI - PMC - PubMed

Publication types

Substances

LinkOut - more resources