. 2014 May 6:14:317.
doi: 10.1186/1471-2407-14-317.

Inhibition of the JAK2/STAT3 pathway in ovarian cancer results in the loss of cancer stem cell-like characteristics and a reduced tumor burden

Affiliations

Inhibition of the JAK2/STAT3 pathway in ovarian cancer results in the loss of cancer stem cell-like characteristics and a reduced tumor burden

Khalid Abubaker et al. BMC Cancer. .

Abstract

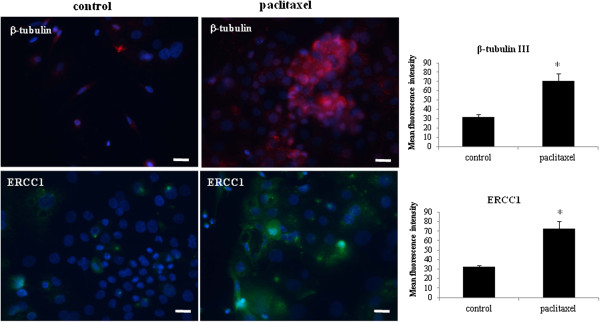
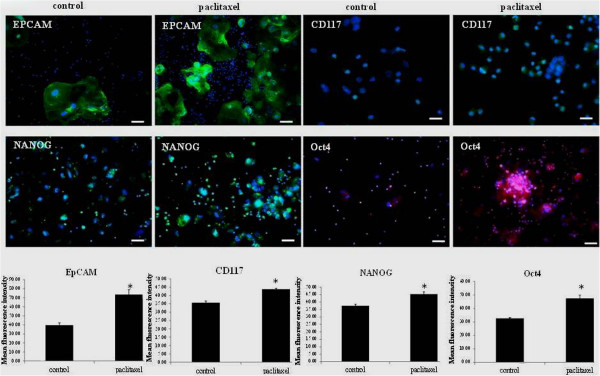
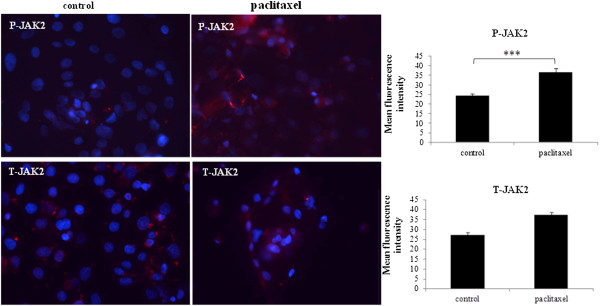
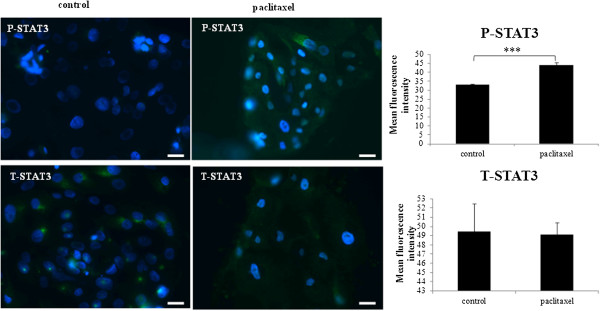
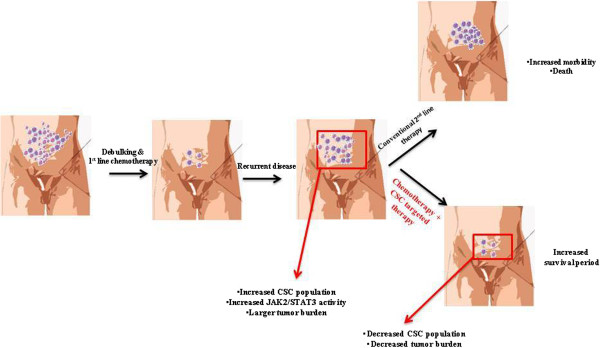
Background: Current treatment of ovarian cancer patients with chemotherapy leaves behind a residual tumor which results in recurrent ovarian cancer within a short time frame. We have previously demonstrated that a single short-term treatment of ovarian cancer cells with chemotherapy in vitro resulted in a cancer stem cell (CSC)-like enriched residual population which generated significantly greater tumor burden compared to the tumor burden generated by control untreated cells. In this report we looked at the mechanisms of the enrichment of CSC-like residual cells in response to paclitaxel treatment.

Methods: The mechanism of survival of paclitaxel-treated residual cells at a growth inhibitory concentration of 50% (GI50) was determined on isolated tumor cells from the ascites of recurrent ovarian cancer patients and HEY ovarian cancer cell line by in vitro assays and in a mouse xenograft model.

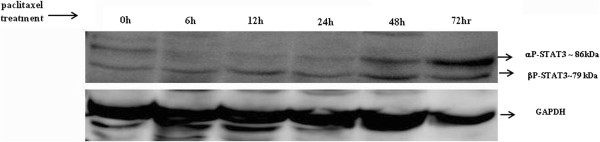
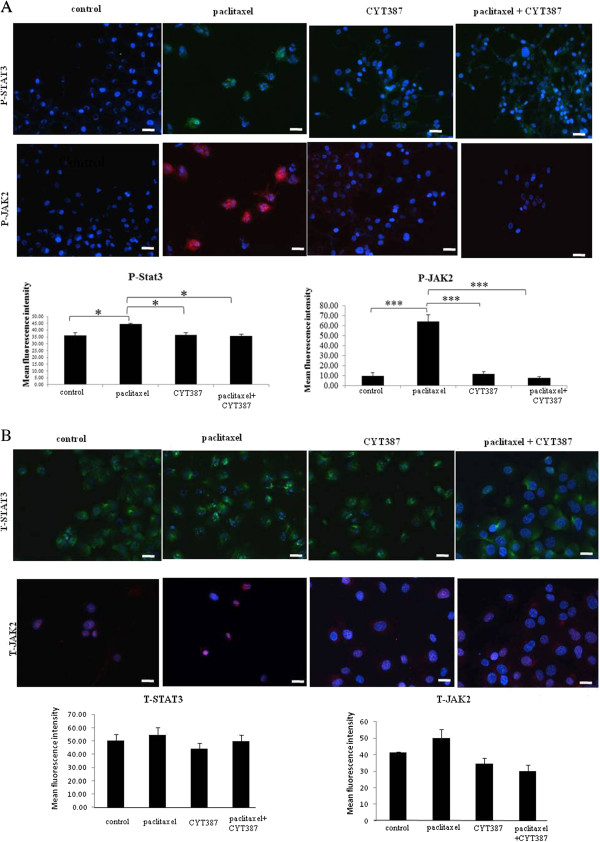
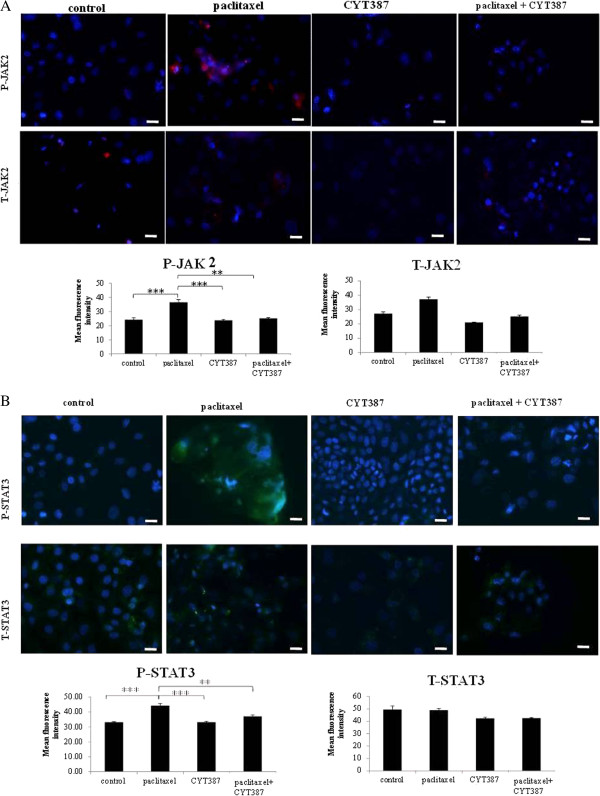
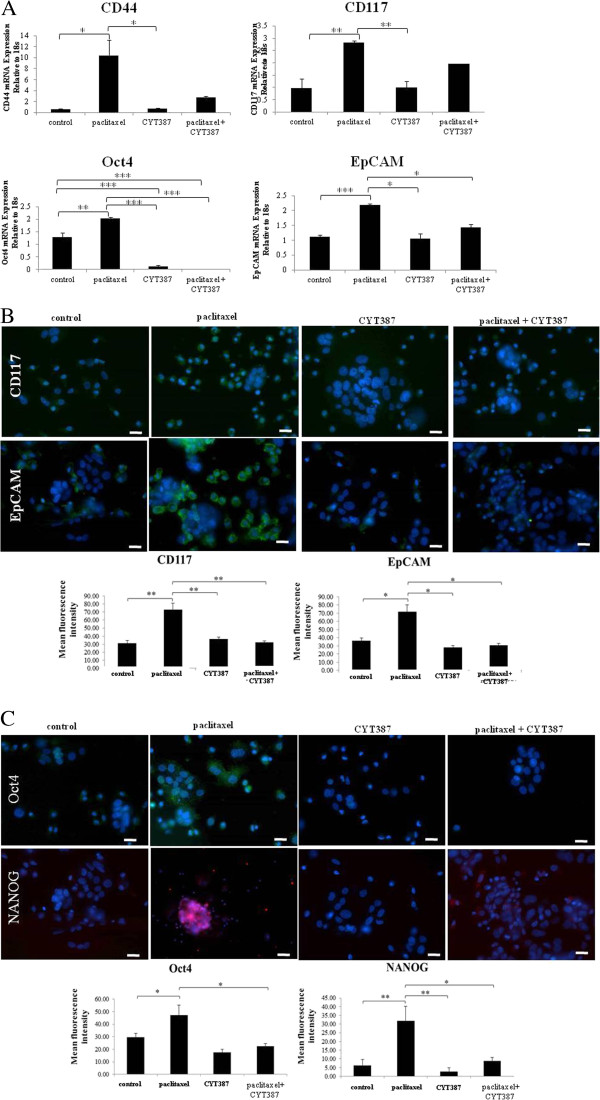
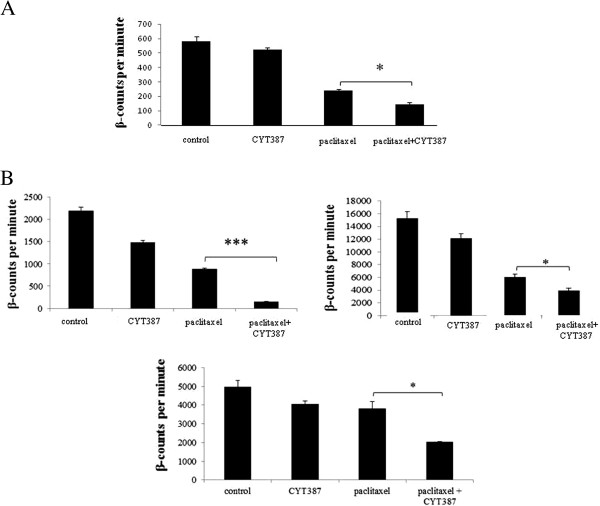
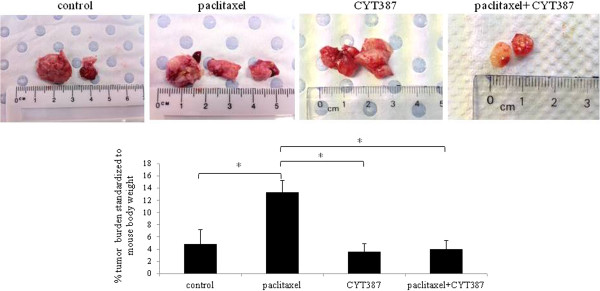
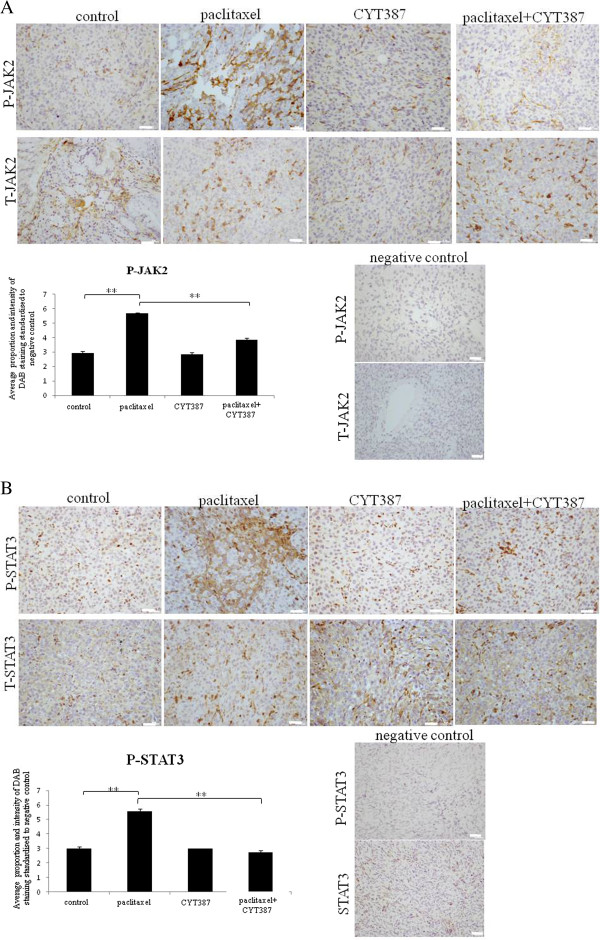
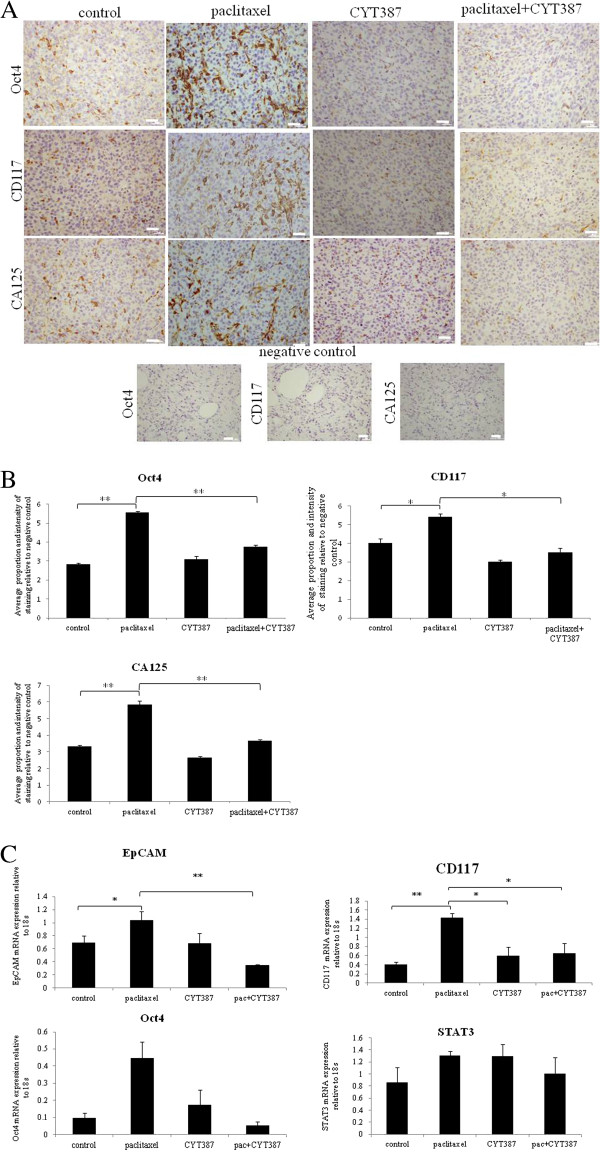
Results: Treatment of isolated tumor cells from the ascites of ovarian cancer patients and HEY ovarian cancer cell line with paclitaxel resulted in a CSC-like residual population which coincided with the activation of Janus activated kinase 2 (JAK2) and signal transducer and activation of transcription 3 (STAT3) pathway in paclitaxel surviving cells. Both paclitaxel-induced JAK2/STAT3 activation and CSC-like characteristics were inhibited by a low dose JAK2-specific small molecule inhibitor CYT387 (1 μM) in vitro. Subsequent, in vivo transplantation of paclitaxel and CYT387-treated HEY cells in mice resulted in a significantly reduced tumor burden compared to that seen with paclitaxel only-treated transplanted cells. In vitro analysis of tumor xenografts at protein and mRNA levels demonstrated a loss of CSC-like markers and CA125 expression in paclitaxel and CYT387-treated cell-derived xenografts, compared to paclitaxel only-treated cell-derived xenografts. These results were consistent with significantly reduced activation of JAK2 and STAT3 in paclitaxel and CYT387-treated cell-derived xenografts compared to paclitaxel only-treated cell derived xenografts.

Conclusions: This proof of principle study demonstrates that inhibition of the JAK2/STAT3 pathway by the addition of CYT387 suppresses the 'stemness' profile in chemotherapy-treated residual cells in vitro, which is replicated in vivo, leading to a reduced tumor burden. These findings have important implications for ovarian cancer patients who are treated with taxane and/or platinum-based therapies.


Figures

Figure 1
Figure 1
Increased expression of β-tubulin III and ERCC1 in ascites-derived tumor cells in response to paclitaxel. Expression and immunolocalisation of β-tubulin III and ERCC1 in ascites-derived tumor cells was evaluated by immunofluorescence using mouse monoclonal (green) and rabbit polyclonal (red) antibodies as described in the Methods. Cellular staining was visualized using secondary Alexa 488 (green) and Alexa 590 (red) fluorescent labelled antibodies while nuclear staining was visualized using DAPI (blue) staining. Images are representative of three independent experiments from three independent patient samples. The mean fluorescence intensity of β-tubulin III and ERCC1 was quantified using Cell-R software. Significant variations between the groups are indicated by *P < 0.05. Magnification 200×; scale bar = 10 μM.
Figure 2
Figure 2
Increased expressions of CSC and embryonic stem cell markers in ascites- derived tumor cells in response to paclitaxel. Expression and localisation of EpCAM, CD117, Oct4 and NANOG in ascites-derived tumor cells in response to paclitaxel treatment was evaluated by immunofluorescence as described in Figure 1. Images are representative of three independent experiments from three independent patient ascites samples. The mean fluorescence intensity of CSC markers CD117, EpCAM and the embryonic stem cell markers NANOG and Oct4 expression in ascites-derived tumor cells was quantified using Cell-R software. Significant variations between the groups are indicated by *P < 0.05. Magnification 200×; scale bar = 10 μM.
Figure 3
Figure 3
Expression and localisation of P-JAK2 and T-JAK2 in ascites-derived tumor cells in response to paclitaxel treatment. The images were evaluated as described in Figure 1. Images are representative of four independent experiments from four patient samples. The mean fluorescence intensity of P-JAK2 and T-JAK2 was quantified using Cell-R software. Significant intergroup variations are indicated by ***P < 0.001. Magnification 200×; scale bar = 10 μM.
Figure 4
Figure 4
Expression and localisation of P-STAT3 and T-STAT3 in ascites-derived tumor cells in response to paclitaxel treatment. The images were evaluated as described in Figure 1. Images are representative of four independent experiments from four patient samples. The mean fluorescence intensity of P-STAT3 and T-STAT3 was quantified using Cell-R software. Significant intergroup variations are indicated by ***P < 0.001. Magnification 200×; scale bar = 10 μM.
Figure 5
Figure 5
Activation of STAT3 in response to paclitaxel treatment in HEY cells. HEY cells were treated with paclitaxel (1 ng/ml) for 6, 12, 24, 48 and 72 hours. Cell lysates were prepared and Western blot was performed as described in the Methods. Total protein loading was determined by probing the membranes for GAPDH. Results are representative of three independent experiments.
Figure 6
Figure 6
Expression of phospho and total JAK2 and STAT3 in control, paclitaxel and paclitaxel plus CYT387-treated HEY cells. (A) Expression and immunolocalisation of phospho (P)-JAK2 (Tyr-1007/1008) and phospho (P)-STAT3 (Tyr-705) in control, paclitaxel, CYT387 and combination of both treatments in HEY cell line was evaluated by immunofluorescence. Three independent experiments were performed in triplicate. The mean fluorescence intensity was quantified using Cell-R software. Significant variations between the groups are indicated by *P<0.05, *** P < 0.001. (B) The expression of total (T)-JAK2 and total (T)-STAT3 was evaluated and quantified as described in Figure 6A. Magnification 200x; scale bar = 10 μM.
Figure 7
Figure 7
Expression and localisation of phosphorylated and total JAK2 and STAT3 in control, paclitaxel and paclitaxel plus CYT387-treated ascites derived tumor cells. (A) Expression and immunolocalisation of phospho (P)-JAK2 (Tyr-1007/1008) and total (T)-JAK2 in control, paclitaxel, CYT387 and combination of both treatments in ascites-derived tumor cells was evaluated as described in Figure 6A. Images are representative of three independent experiments performed in triplicate using three independent patient samples. Significant variations between the groups are indicated by **P<0.01, ***P < 0.001. (B) The expression of phospho (P)-STAT3 and total (T)-STAT3 was evaluated and quantified as described in Figure 6A. Significant variations between the groups are indicated by **P<0.01, ***P < 0.001. Magnification 200x; scale bar = 10 μM.
Figure 8
Figure 8
Expression of CSC markers in control, paclitaxel, CYT387 and paclitaxel plus CYT387-treated HEY cells and ascites derived tumor cells. (A) RNA from control and treated HEY cells was extracted, cDNA was prepared and qPCR for EpCAM, CD44, CD117 and Oct4 was performed as described in the Methods section. The resultant mRNA levels were normalized to 18S mRNA. The experiment was performed using four independent samples in triplicate. Significant intergroup variations are indicated by *P <0.05, **P<0.01, ***P < 0.001. (B) Expression and localisation of EpCAM, CD117 in ascites-derived tumor cells in response to paclitaxel, CYT387 and a combination of paclitaxel+CYT387 treatment was evaluated and quantified by immunofluorescence as described in Figure 1. Images are representative of three independent experiments using three independent patient ascites samples. Significant intergroup variations are indicated by *P <0.05, **P < 0.01. (C) The expression and localisation of embryonic stem cell markers NANOG and Oct4 in ascites-derived tumor cells was evaluated and quantified as described in Figure 1. Significant variations between the groups are indicated by *P <0.05, **P<0.01. Magnification 200x; scale bar = 10 μM.
Figure 9
Figure 9
Effect of CYT387 on the proliferation of HEY cells and ascites-derived tumor cells. (A) HEY cells were treated with paclitaxel, CYT387 and combination of CYT387 and paclitaxel for three days. [3H]-thymidine was added and the cells were harvested as described in the Materials. The data is a representation of three independent experiments performed in triplicate. Significant variations between the groups are indicated by *P <0.05. (B) Ascites-derived tumor cells obtained from three independent patients were treated as described in Figure 9A. [3H]-thymidine uptake assay was performed as described in the Materials. The data is a representation of three independent experiments performed in triplicate on three ascites samples. Significant variations between the groups are indicated by *P <0.05, ***P < 0.001.
Figure 10
Figure 10
Tumor burden in mice injected with control, paclitaxel, CYT387 and combination of paclitaxel plus CYT387-treated cells. Total tumor burden obtained from mice 6 weeks after ip injection of control, paclitaxel-treated, paclitaxel plus CYT387-treated and combination of both CYT387 and paclitaxel-treated HEY cells (n = 5/group). 5×10⁶ cells were inoculated in each case. *P < 0.05, significant increase in tumor burden in paclitaxel-treated HEY cell derived tumors compared to control untreated group; and paclitaxel-treated HEY cell derived tumors to paclitaxel plus CYT387-treated cell derived tumors. Images represent tumors debulked from one mouse in each group.
Figure 11
Figure 11
Expression of P-JAK2, T-JAK2, P-STAT3 and T-STAT3 in mouse tumors generated from ip transplantation of control, paclitaxel, CYT387 and combination of paclitaxel plus CYT387- treated HEY cells. (A) Immunohistochemistry staining of tumor sections for the expression of P-JAK2 and T-JAK2 was performed as described in Materials. Quantification of staining was obtained as described in Materials by using three independent xenografts. Significant variations between the groups are indicated by **P<0.01. (B) Tumor sections were stained for P-STAT3 and T-STAT3 and quantification of the data was obtained as described in Figure 11A. Significant variations between the groups are indicated by **P<0.01. Magnification 200×, scale bar = 10 μm
Figure 12
Figure 12
Expression of CSC markers and CA125 in mouse tumors generated from ip transplantation of control, paclitaxel, CYT387 and combination of paclitaxel and CYT387-treated HEY cells. (A) Immunohistochemistry staining of tumor sections for the expression of Oct4, CD117 and CA125 was performed as described in Figure 11A. (B) Quantification of Oct4, CD117 and CA125 staining was obtained as described in Figure 11A. Significant variations between the groups are indicated by *P<0.05 and **P<0.01. Magnification 200×, scale bar = 10 μm. (C) The mRNA expression of EpCAM, CD44, CD117 and Oct4 in control, paclitaxel, CYT387 and paclitaxel plus CYT387-treated HEY cells-derived xenografts was performed by q-PCR as described in the Methods section. The resultant mRNA levels were normalised to 18S mRNA. The experiments were performed using four independent samples in triplicate. Significant intergroup variations are indicated by *P <0.05, **P<0.01.
Figure 13
Figure 13
A model of chemoresistance and associated recurrence in ovarian cancer. Adapted from Googleimages, Wisegeek.com. At diagnosis, majority of the ovarian cancer patients present with high-grade tumors and associated ascites which contains tumor cells as well as CSCs. After the first line of ‘traditional chemotherapy’ treatment majority of the tumor cells are eradicated leaving behind residual tumors which mainly consist of chemoresistant CSCs with enhanced level of phosphorylated JAK2/STAT3. These patients are in remission for 6–22 months. At recurrence, patients present with larger tumor burden which has increased numbers of CSCs. Under the current treatment protocol most patients are treated with subsequent lines of chemotherapy (which differs in patients), resulting in successive recurrences which ultimately leads to patient mortality. However, if the patients are treated with ‘traditional chemotherapy’ in combination with JAK2/STAT3 inhibitors, this will eradicate CSCs during the first line of treatment, and/or subsequent lines of treatments. This consequently may result in decreased tumor burden with increased disease free survival period and better treatment outcomes.

Similar articles

Cited by

References

    1. Ozols RF. Systemic therapy for ovarian cancer: current status and new treatments. Semin Oncol. 2006;33(2 Suppl 6):S3–S11. - PubMed
    1. Lengyel E. Ovarian cancer development and metastasis. Am J Pathol. 2010;177(3):1053–1064. doi: 10.2353/ajpath.2010.100105. - DOI - PMC - PubMed
    1. Kipps E, Tan DS, Kaye SB. Meeting the challenge of ascites in ovarian cancer: new avenues for therapy and research. Nat Rev Cancer. 2013;13(4):273–282. doi: 10.1038/nrc3432. - DOI - PMC - PubMed
    1. Telleria CM. Repopulation of ovarian cancer cells after chemotherapy. Canc Growth Metastasis. 2013;6:15–21. - PMC - PubMed
    1. Green H, Soderkvist P, Rosenberg P, Horvath G, Peterson C. ABCB1 G1199A polymorphism and ovarian cancer response to paclitaxel. J Pharm Sci. 2008;97(6):2045–2048. doi: 10.1002/jps.21169. - DOI - PubMed

Publication types

MeSH terms