. 2014 May 23:14:285.
doi: 10.1186/1471-2334-14-285.

Analyzing spatial clustering and the spatiotemporal nature and trends of HIV/AIDS prevalence using GIS: the case of Malawi, 1994-2010

Affiliations

Analyzing spatial clustering and the spatiotemporal nature and trends of HIV/AIDS prevalence using GIS: the case of Malawi, 1994-2010

Leo C Zulu et al. BMC Infect Dis. .

Abstract

Background: Although local spatiotemporal analysis can improve understanding of geographic variation of the HIV epidemic, its drivers, and the search for targeted interventions, it is limited in sub-Saharan Africa. Despite recent declines, Malawi's estimated 10.0% HIV prevalence (2011) remained among the highest globally. Using data on pregnant women in Malawi, this study 1) examines spatiotemporal trends in HIV prevalence 1994-2010, and 2) for 2010, identifies and maps the spatial variation/clustering of factors associated with HIV prevalence at district level.

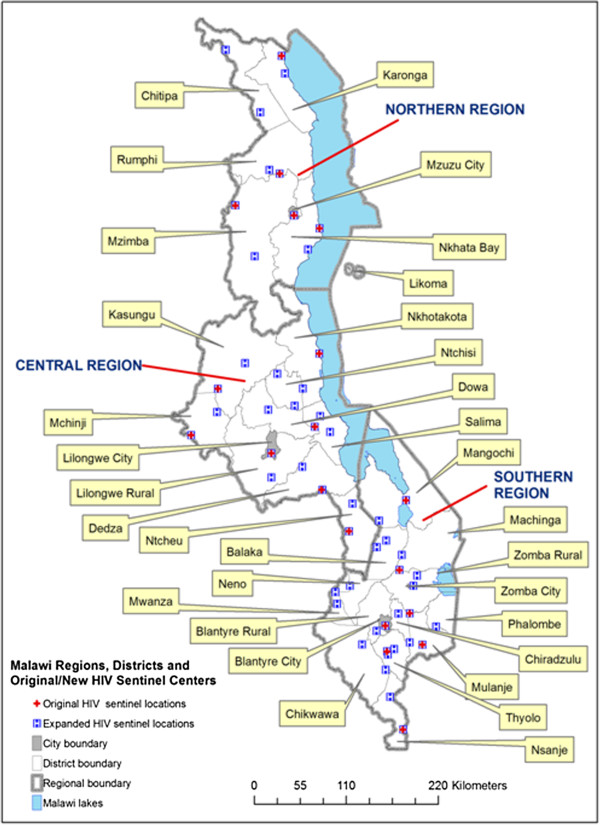
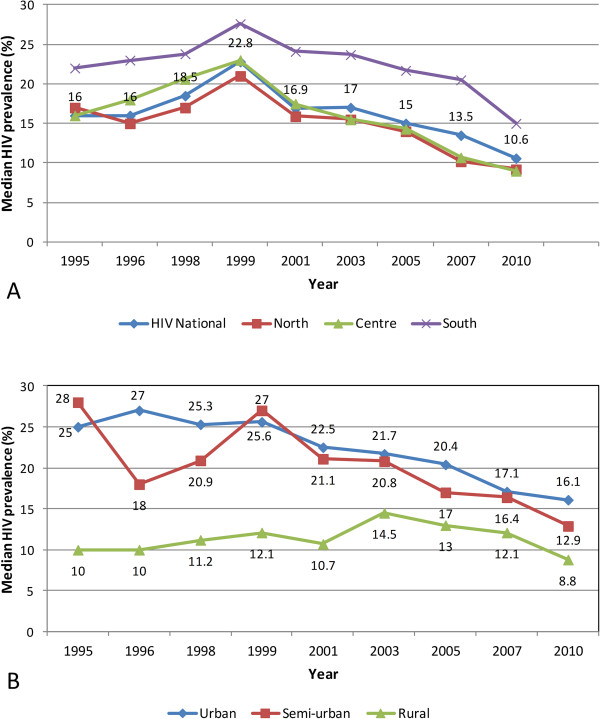
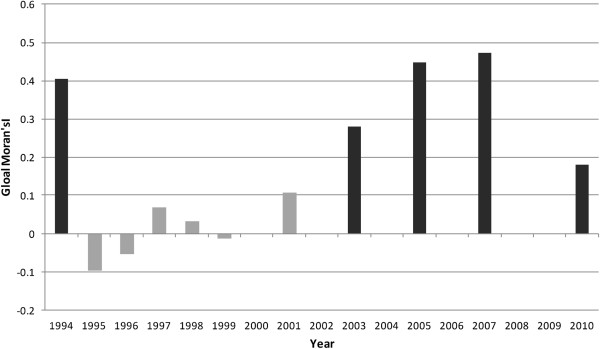
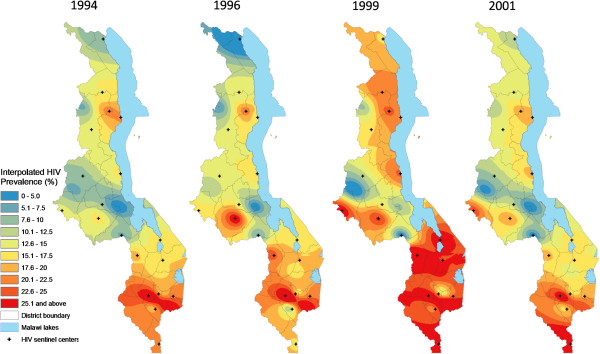
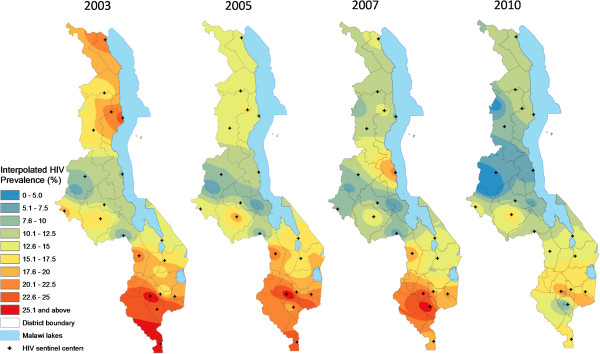
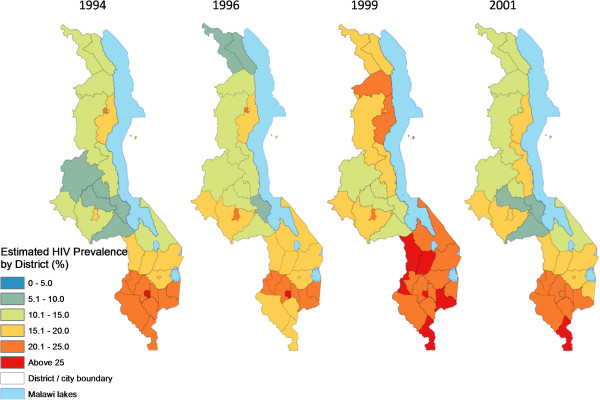
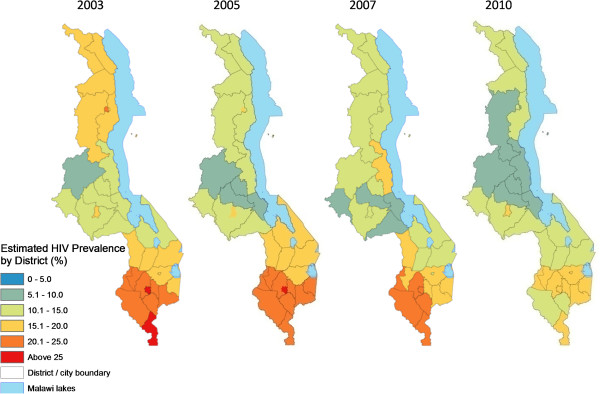
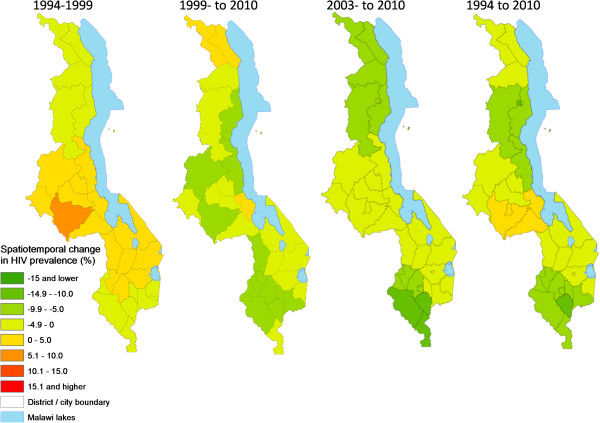
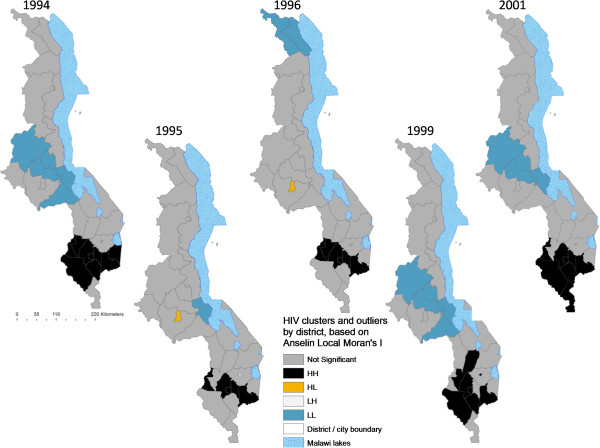
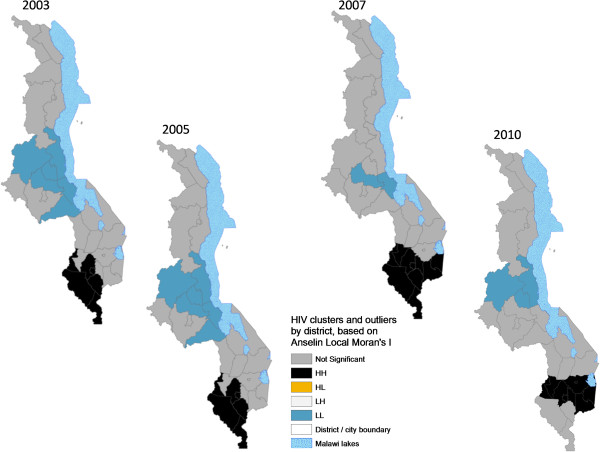
Methods: Inverse distance weighting was used within ArcGIS Geographic Information Systems (GIS) software to generate continuous surfaces of HIV prevalence from point data (1994, 1996, 1999, 2001, 2003, 2005, 2007, and 2010) obtained from surveillance antenatal clinics. From the surfaces prevalence estimates were extracted at district level and the results mapped nationally. Spatial dependency (autocorrelation) and clustering of HIV prevalence were also analyzed. Correlation and multiple regression analyses were used to identify factors associated with HIV prevalence for 2010 and their spatial variation/clustering mapped and compared to HIV clustering.

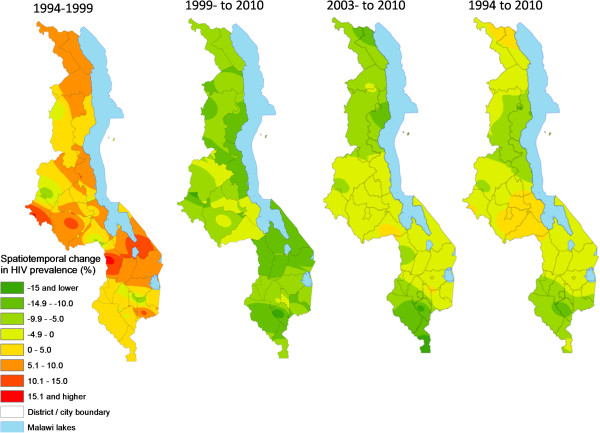
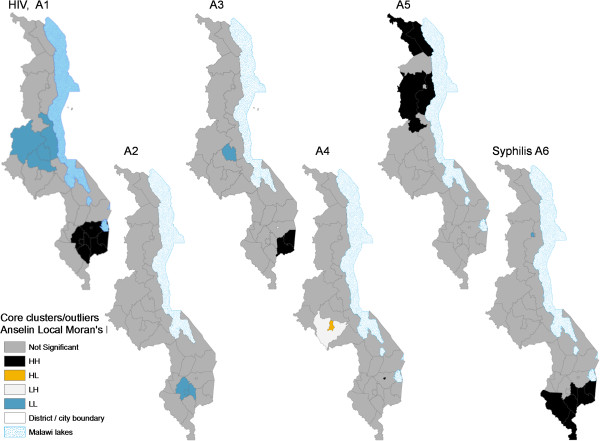
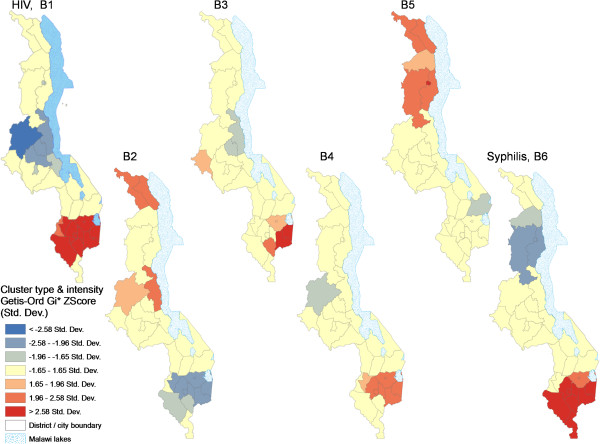
Results: Analysis revealed wide spatial variation in HIV prevalence at regional, urban/rural, district and sub-district levels. However, prevalence was spatially leveling out within and across 'sub-epidemics' while declining significantly after 1999. Prevalence exhibited statistically significant spatial dependence nationally following initial (1995-1999) localized, patchy low/high patterns as the epidemic spread rapidly. Locally, HIV "hotspots" clustered among eleven southern districts/cities while a "coldspot" captured configurations of six central region districts. Preliminary multiple regression of 2010 HIV prevalence produced a model with four significant explanatory factors (adjusted R2 = 0.688): mean distance to main roads, mean travel time to nearest transport, percentage that had taken an HIV test ever, and percentage attaining a senior primary education. Spatial clustering linked some factors to particular subsets of high HIV-prevalence districts.

Conclusions: Spatial analysis enhanced understanding of local spatiotemporal variation in HIV prevalence, possible underlying factors, and potential for differentiated spatial targeting of interventions. Findings suggest that intervention strategies should also emphasize improved access to health/HIV services, basic education, and syphilis management, particularly in rural hotspot districts, as further research is done on drivers at finer scale.


Figures

Figure 1
Figure 1
Malawi’s administrative boundaries and location of sentinel antenatal clinic. The figure shows the original 19, expanded 54 (in 2007), and overlapping ANC network for HIV surveillance. It also shows Malawi’s three regions, 28 districts, and four major cities, but Likoma (Island) was left out of the district regression analysis.
Figure 2
Figure 2
National, regional, rural, and urban trends in HIV prevalence for pregnant women, 1995-2010. A shows the national median prevalence rate (labels on chart, percent) relative to trends for the northern, central and southern regions. B shows temporal trends in HIV prevalence by residence type: urban, semi-urban and rural. Data sources: Government of Malawi 2012, NAC 2011.
Figure 3
Figure 3
Global Moran’s I and Spatial Dependence in HIV Prevalence, 1994-2010. The black bars in Figure 3 show global Moran’s I values in years for which the statistic (and spatial autocorrelation) was statistically significant at p ≤ 0.01, the dark grey at p = 0.05 or p = 0.10), and the light grey bars for years with no statistical significance. The positive Moran’s I values indicate positive autocorrelation, i.e., HIV prevalence values at neighboring locations were similarly high or low, while negative values indicate negative autocorrelation with high prevalence values next to low ones.
Figure 4
Figure 4
Interpolated spatiotemporal trends of the HIV/AIDS Epidemic among pregnant women, 1994 – 2001. Continuous images produced by interpolating (IDW method at 1 km spatial resolution) HIV prevalence (%) among pregnant women attending the original 19 HIV sentinel centers in 1994, 1996, 1999 and 2001.
Figure 5
Figure 5
Interpolated spatiotemporal trends of the HIV/AIDS Epidemic among pregnant women, 2003 – 2010. Continuous images produced by interpolating (IDW method at 1 km spatial resolution) HIV prevalence (%) among pregnant women attending the original 19 HIV sentinel centers in 2003, 2005, 2007 and 2010.
Figure 6
Figure 6
Spatiotemporal trends in estimated average HIV prevalence among pregnant women by district, 1994-2001. District/city estimates of HIV/AIDS prevalence were derived by averaging prevalence for all 1-km cells in the interpolated surfaces falling within each district and major city for 1994, 1996, 1999 and 2001. These rates are indicative and only for assessing spatial patterns and temporal change, rather than authoritative district estimates.
Figure 7
Figure 7
Spatiotemporal trends in estimated average HIV prevalence among pregnant women by district, 2003-2010. District/city estimates of HIV/AIDS prevalence were derived by averaging prevalence for all 1-km cells in the interpolated surfaces falling within each district and major city for 1994, 1996, 1999 and 200. These rates are indicative and only for assessing spatial patterns and temporal change. They are not authoritative district estimates.
Figure 8
Figure 8
Temporal change in continuous HIV prevalence among pregnant women for various periods between 1994 and 2010. Negative values (shades of green) represent a decrease (%) in prevalence and positive values an increase, for the continuous surfaces for the time periods 1994-1999, 1999-2010, 2003-2010 and 1994-2010.
Figure 9
Figure 9
Temporal change in district-level estimates of HIV prevalence among pregnant women for various periods between 1994 and 2010. Negative values (shades of green) represent a decrease (%) in prevalence and positive values an increase, for the continuous surfaces for the time periods 1994-1999, 1999-2010, 2003-2010 and 1994-2010.
Figure 10
Figure 10
Spatiotemporal patterns of HIV hotspots and outliers by district, 1994-2001. Estimates of district HIV prevalence were based on the original 19 ANCs to allow longitudinal continuity from 1994 to 2010. Figure 10 shows the years 1994, 1995, 1996, 1999 and 2001. The year 1995 is included along with 1996 to illustrate the presence of outliers during periods of significant negative autocorrelation (Figure 3).
Figure 11
Figure 11
Spatiotemporal patterns of HIV hotspots and outliers by district, 2003-2010. Estimates of district HIV prevalence were based on the original 19 ANCs for longitudinal depth. Figure 11 shows the years 2003, 2005, 2007 and 2010.
Figure 12
Figure 12
Distribution of core spatial clusters and outliers of HIV prevalence relative to main explanatory variables. The core clusters and outliers of HIV prevalence and of identified main explanatory variables are based on the Anselin Local Mora’s I. The variables displayed are: HIV, A1) 2010 HIV prevalence, A2) mean distance to main roads (km), A3) mean travel time to main public transport for the 30-44 age group, A4) percentage reporting having ever had an HIV test, A5) percentage who had attained senior primary education, and A6) 2010 syphilis prevalence (%).
Figure 13
Figure 13
Spatial patterns and intensity of HIV prevalence hotspots relative to patterns of main explanatory variables. The intensity of hotspots/coldspots of HIV prevalence and of identified main explanatory variables are based on the Getis-OrdGi* ZScore measured in standard deviations. The variables displayed are: HIV, B1) 2010 HIV prevalence, B2) mean distance to main roads (km), B3) mean travel time to main public transport for the 30-44 age group, B4) percentage reporting having ever had an HIV test, B5) percentage who had attained senior primary education, and B6) 2010 syphilis prevalence (%).

Similar articles

Cited by

References

    1. Tanser F, Bärnighausen T, Cooke GS, Newell ML. Localized spatial clustering of HIV infections in a widely disseminated rural South African epidemic. Int J Epidemiol. 2009;14:1008–1016. doi: 10.1093/ije/dyp148. - DOI - PMC - PubMed
    1. Kalipeni E, Zulu L. Using GIS to model and forecast HIV/AIDS rates in Africa, 1986–2010. Prof Geogr. 2008;14:33–53. doi: 10.1080/00330120701724061. - DOI
    1. Messina JP, Emch M, Muwonga J, Mwandagalirwa K, Edidi SB, Mama N, Okenge A, Meshnick SR. Spatial and socio-behavioral patterns of HIV prevalence in the Democratic Republic of Congo. Soc Sci Med. 2010;14:1428–1435. doi: 10.1016/j.socscimed.2010.07.025. - DOI - PMC - PubMed
    1. Mayer JD. The geographical understanding of HIV/AIDS in sub-Saharan Africa. NorskGeografiskTidsskrift - Norwegian J Geogr. 2005;14:6–13.
    1. Uthman O, Yahaya I, Ashfaq K, Uthman M. A trend analysis and sub-regional distribution in number of people living with HIV and dying with TB in Africa, 1991 to 2006. I J Health Geogr. 2009;14:65. doi: 10.1186/1476-072X-8-65. - DOI - PMC - PubMed