. 2014 May 30;15(5):R75.
doi: 10.1186/gb-2014-15-5-r75.

Lentiviral and targeted cellular barcoding reveals ongoing clonal dynamics of cell lines in vitro and in vivo

Lentiviral and targeted cellular barcoding reveals ongoing clonal dynamics of cell lines in vitro and in vivo

Shaina N Porter et al. Genome Biol. .

Abstract

Background: Cell lines are often regarded as clonal, even though this simplifies what is known about mutagenesis, transformation and other processes that destabilize them over time. Monitoring these clonal dynamics is important for multiple areas of biomedical research, including stem cell and cancer biology. Tracking the contributions of individual cells to large populations, however, has been constrained by limitations in sensitivity and complexity.

Results: We utilize cellular barcoding methods to simultaneously track the clonal contributions of tens of thousands of cells. We demonstrate that even with optimal culturing conditions, common cell lines including HeLa, K562 and HEK-293 T exhibit ongoing clonal dynamics. Starting a population with a single clone diminishes but does not eradicate this phenomenon. Next, we compare lentiviral and zinc-finger nuclease barcode insertion approaches, finding that the zinc-finger nuclease protocol surprisingly results in reduced clonal diversity. We also document the expected reduction in clonal complexity when cells are challenged with genotoxic stress. Finally, we demonstrate that xenografts maintain clonal diversity to a greater extent than in vitro culturing of the human non-small-cell lung cancer cell line HCC827.

Conclusions: We demonstrate the feasibility of tracking and quantifying the clonal dynamics of entire cell populations within multiple cultured cell lines. Our results suggest that cell heterogeneity should be considered in the design and interpretation of in vitro culture experiments. Aside from clonal cell lines, we propose that cellular barcoding could prove valuable in modeling the clonal behavior of heterogeneous cell populations over time, including tumor populations treated with chemotherapeutic agents.


Figures

Figure 1
Figure 1
Barcode lentiviral vector, sequencing and analysis workflow. (a) The 20 bp DNA barcode was cloned into the non-coding region of a SIN (self-inactivating) lentiviral vector upstream of a UBC-eGFP cassette. The P5 Illumina sequencing adapter sequence was integrated next to the barcode, and the P7 adapter was added during the PCR amplification step (primer positions shown). (b) This PCR results in a 250 bp fragment that includes a 4 bp indexing tag to allow pooling of multiple samples into a single lane of a flow cell, in addition to the 20 bp random barcode sequence, and flanked on either side by eight 'anchor' bases, which act as markers to identify true barcode sequences within the sequencing data. Finally, the fragments contain a spacer of approximately 90 bp and the second (P7) Illumina adapter for sequencing. Integrating the adapter into the barcode vector allows for single-end 36 bp (short) sequencing reads in which the barcode end is always sequenced. (c) Data analysis workflow.
Figure 2
Figure 2
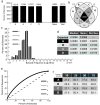
Barcode plasmid library analysis. Results from four separate PCR amplification and sequencing runs of the plasmid barcode library (A to D). (a) The number of barcodes found in each replicate after analysis and trimming. 'Mean' is the average number of barcodes for the four replicates; 'Total' is the number of unique barcodes found within the four samples combined. (b) Venn diagram demonstrating the amount of overlap of barcodes among the four replicates. Darker shading indicates larger numbers of barcodes. (c) Barcodes were counted and grouped in Log 2 bins based on percentage (frequency) within the population, from least to greatest. The percentage of the barcodes in each bin is shown. (d) The predicted (Expected) and experimentally determined median and mean barcode frequencies are shown as percentages, as well as the standard deviation from the mean. (e) The percentage of barcodes, ranked from most to least frequent plotted by what percentage of the total sequences they made up. Dashed line represents perfectly equal representation of barcodes. (f) The percentage of sequences made up by the top indicated percentages of the barcodes for each sample.
Figure 3
Figure 3
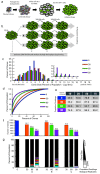
K562 cellular barcode libraries. (a) Workflow from plasmid barcode library to cellular barcode library. Unique barcodes are represented as different colored rectangles; barcoded cells also express eGFP. (b) Experimental design of passaging experiments. (c) Clones were counted and binned in Log 2 bins based on percentage (frequency) within the population, from least to greatest. The percentage of the clones in each bin is shown. Inset shows magnification of larger bins. K562 biological replicate A is shown (others are shown in Additional file 2). (d) The percentage of clones, ranked from most to least frequent, plotted by what percentage of the population they made up. (e) The percentage of the population made up by the top indicated percentages of clones for each sample. (f) The number of clones found in each sample. (g) Rank order barcodes by percentage of sequences for each sample; greatest to least. Any clones ≥1% are delimited by white sections within the column, while the remaining population of clones smaller than 1% are represented by the black area in each column. The same clone occurring as a major clone in more than one sample is identified by color.
Figure 4
Figure 4
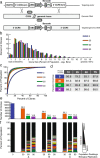
Targeted barcode libraries in K562 cells. (a) Schema for targeting barcodes to the CCR5 locus. Targeting vector (repair template; top) includes a UBC-driven GFP gene upstream of a 20 bp barcode, and the P5 Illumina adapter sequence in reverse between CCR5 arms of homology. HSV-TK (herpes simplex virus thymidine kinase) is included outside of the arms of homology to allow drug selection against clones with off-target integration of the vector. Middle: the site of the ZFN-induced double strand DNA break. Bottom: the correctly targeted locus after homologous recombination with the targeting vector. (b) Clones were counted and binned in Log 2 bins based on percentage (frequency) within the population, from least to greatest. The percentage of the clones in each bin is shown. Inset shows magnification of larger bins. K562 biological replicate A of the CCR5-targeted barcode experiment is shown (others are shown in Additional file 7). (c) The percentage of clones, ranked from most to least frequent, plotted by what percentage of the population they made up. (d) The percentage of the population made up by the top indicated percentages of the clones in each sample. (e) The number of clones found in each sample. (f) Rank order clones by percentage of the population for each sample; greatest to least. Any clones ≥1% are delimited by white sections, the remaining population of clones smaller than 1% are represented by black in each column. The same clone occurring as a major clone in more than one sample is indicated with color.
Figure 5
Figure 5
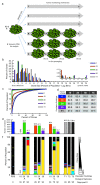
HCC827 barcode libraries in vitro and in vivo. (a) Diagram of HCC827 passaging experiments. (b) Clones were counted and binned in Log 2 bins based on percentage (frequency) within the population, from least to greatest. The percentage of clones in each bin is shown. Inset shows magnification of larger bins. HCC827 biological replicate A and tumor 1 are shown (others are shown in Additional files 14 (in vitro) and 15 (tumors)). (c) The percentage of clones, ranked from most to least frequent, plotted by what percentage of the population they made up. (d) The percentage of the population made up by the top indicated percentages of clones for each sample. (e) The number of clones found in each sample. (f) Rank order clones by percentage of the population for each sample; greatest to least. Any clones ≥1% are shown as white sections, the remaining population of clones smaller than 1% are represented by black in each column. The same barcode occurring as a major clone in more than one sample is marked by color. Stars in PD 0 column indicate positions of yellow, green, and blue clones in that sample. Days post-PD 0 are listed beneath each sample.

Similar articles

Cited by

References

    1. Ford CE, Hamerton JL, Barnes DW, Loutit JF. Cytological identification of radiation-chimaeras. Nature. 1956;177:452–454. doi: 10.1038/177452a0. - DOI - PubMed
    1. Wu AM, Till JE, Siminovitch L, McCulloch EA. Cytological evidence for a relationship between normal hemotopoietic colony-forming cells and cells of the lymphoid system. J Exp Med. 1968;127:455–464. doi: 10.1084/jem.127.3.455. - DOI - PMC - PubMed
    1. Smith LG, Weissman IL, Heimfeld S. Clonal analysis of hematopoietic stem-cell differentiation in vivo. Proc Natl Acad Sci U S A. 1991;88:2788–2792. doi: 10.1073/pnas.88.7.2788. - DOI - PMC - PubMed
    1. Harrison DE, Astle CM, Lerner C. Number and continuous proliferative pattern of transplanted primitive immunohematopoietic stem cells. Proc Natl Acad Sci U S A. 1988;85:822–826. doi: 10.1073/pnas.85.3.822. - DOI - PMC - PubMed
    1. Weber K, Thomaschewski M, Warlich M, Volz T, Cornils K, Niebuhr B, Tager M, Lutgehetmann M, Pollok JM, Stocking C, Dandri M, Benten D, Fehse B. RGB marking facilitates multicolor clonal cell tracking. Nat Med. 2011;17:504–509. doi: 10.1038/nm.2338. - DOI - PubMed

Publication types