

Large-scale patterns of genetic variation in a female-biased dispersing passerine: the importance of sex-based analyses
- PMID: 24886720
- PMCID: PMC4041750
- DOI: 10.1371/journal.pone.0098574
Large-scale patterns of genetic variation in a female-biased dispersing passerine: the importance of sex-based analyses
Abstract
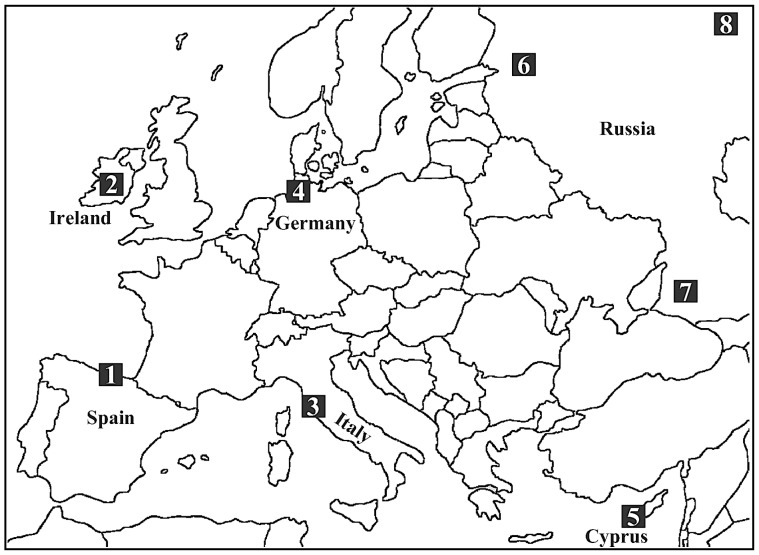
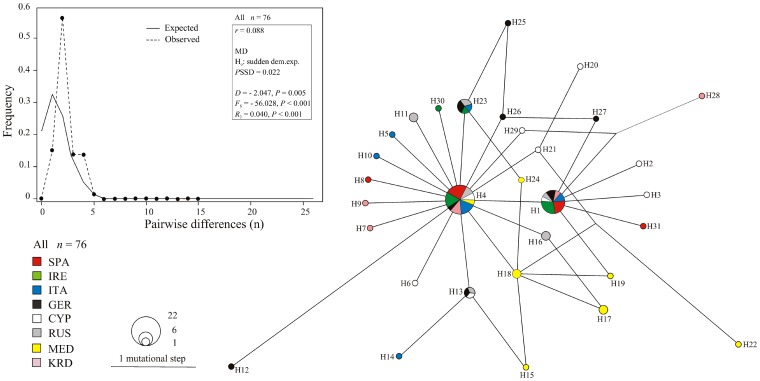
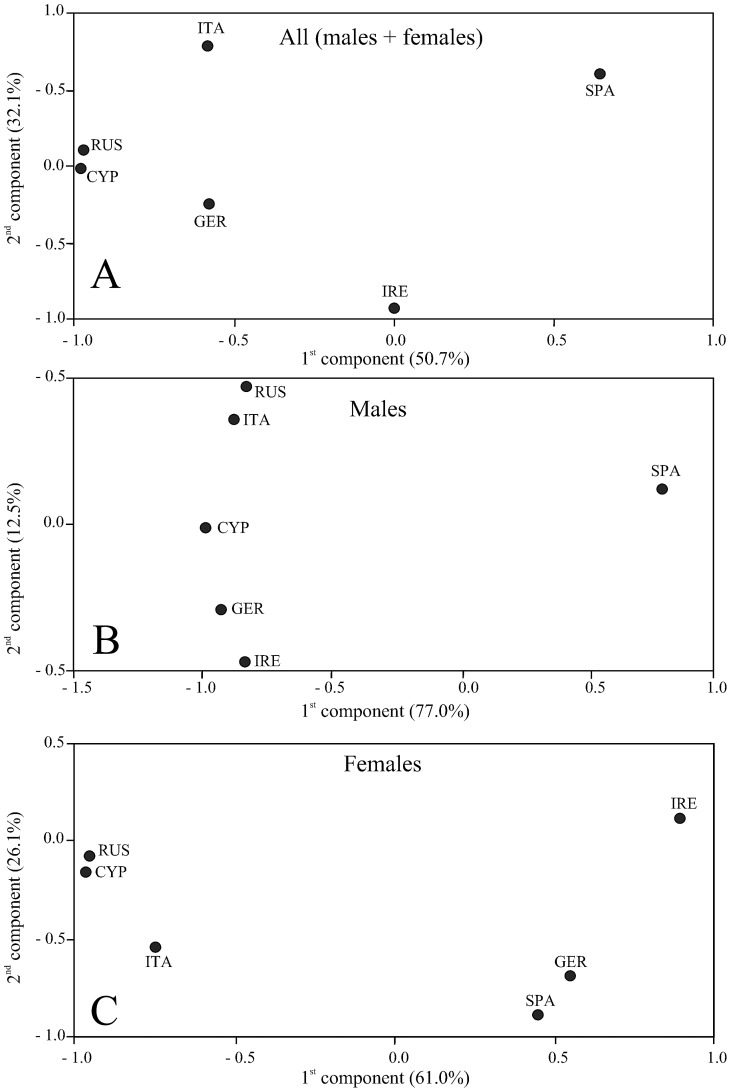
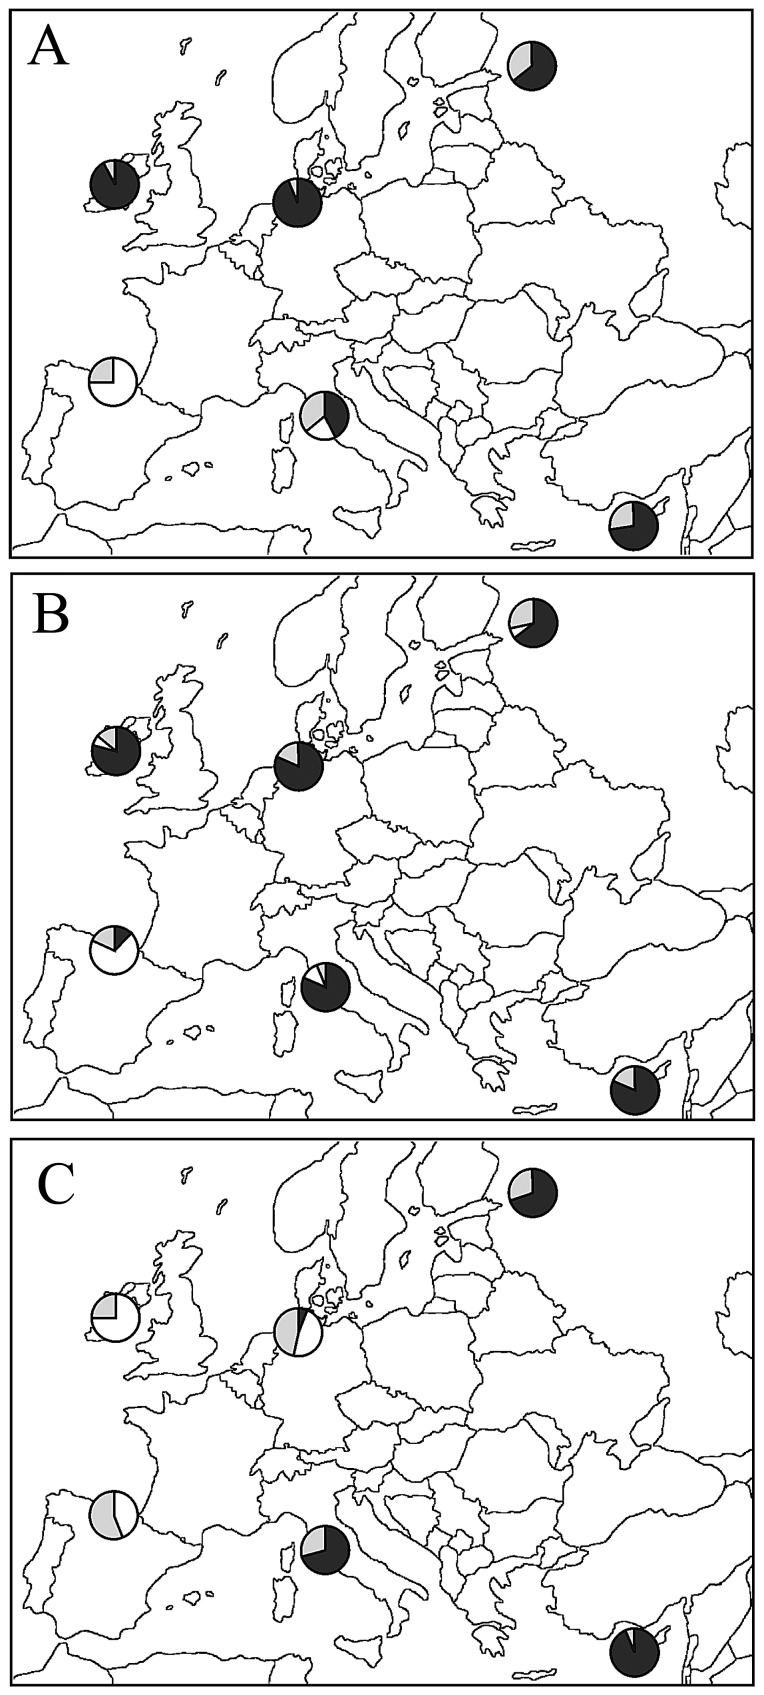
Dispersal affects the distribution, dynamics and genetic structure of natural populations, and can be significantly different between sexes. However, literature records dealing with the dispersal of migratory birds are scarce, as migratory behaviour can notably complicate the study of dispersal. We used the barn swallow Hirundo rustica as model taxon to investigate patterns of genetic variability in males and in females of a migratory species showing sex-biased dispersal. We collected blood samples (n = 186) over the period 2006 to 2011 from adults (H. r. rustica subspecies) nesting in the same breeding site at either high (Ireland, Germany and Russia) or low (Spain, Italy and Cyprus) latitude across Europe. We amplified the Chromo Helicase DNA gene in all birds in order to warrant a sex-balanced sample size (92 males, 94 females). We investigated both uniparental (mitochondrial ND2 gene) and biparental (microsatellite DNA: 10 loci) genetic systems. The mtDNA provided evidence for demographic expansion yet no significant partition of the genetic variability was disclosed. Nevertheless, a comparatively distant Russian population investigated in another study, whose sequences were included in the present dataset, significantly diverged from all other ones. Different to previous studies, microsatellites highlighted remarkable genetic structure among the studied populations, and pointed to the occurrence of differences between male and female barn swallows. We produced evidence for non-random patterns of gene flow among barn swallow populations probably mediated by female natal dispersal, and we found significant variability in the philopatry of males of different populations. Our data emphasize the importance of taking into account the sex of sampled individuals in order to obtain reliable inferences on species characterized by different patterns of dispersal between males and females.
Conflict of interest statement
Figures
Similar articles
-
Sex-biased gene flow in spectacled eiders (Anatidae): inferences from molecular markers with contrasting modes of inheritance.Evolution. 2001 Oct;55(10):2105-15. doi: 10.1111/j.0014-3820.2001.tb01325.x. Evolution. 2001. PMID: 11761069
-
Population genetics and morphological comparisons of migratory European (Hirundo rustica rustica) and sedentary East-Mediterranean (Hirundo rustica transitiva) barn swallows.J Hered. 2012 Jan-Feb;103(1):55-63. doi: 10.1093/jhered/esr114. Epub 2011 Nov 9. J Hered. 2012. PMID: 22071313
-
Population and colony-level determinants of tertiary sex ratio in the declining barn swallow.PLoS One. 2013;8(2):e56493. doi: 10.1371/journal.pone.0056493. Epub 2013 Feb 13. PLoS One. 2013. PMID: 23418577 Free PMC article.
-
The absence of sex-biased dispersal in the cooperatively breeding grey-crowned babbler.J Anim Ecol. 2011 Jan;80(1):69-78. doi: 10.1111/j.1365-2656.2010.01761.x. Epub 2010 Nov 4. J Anim Ecol. 2011. PMID: 21054379
-
Sex-biased dispersal: a review of the theory.Biol Rev Camb Philos Soc. 2019 Apr;94(2):721-736. doi: 10.1111/brv.12475. Epub 2018 Oct 24. Biol Rev Camb Philos Soc. 2019. PMID: 30353655 Free PMC article. Review.
Cited by
-
Genetic diversity and sex-biased dispersal in the brown spotted pitviper (Protobothrops mucrosquamatus): Evidence from microsatellite markers.Ecol Evol. 2022 Mar 1;12(3):e8652. doi: 10.1002/ece3.8652. eCollection 2022 Feb. Ecol Evol. 2022. PMID: 35261743 Free PMC article.
-
Dried Blood Spots technology for veterinary applications and biological investigations: technical aspects, retrospective analysis, ongoing status and future perspectives.Vet Res Commun. 2022 Sep;46(3):655-698. doi: 10.1007/s11259-022-09957-w. Epub 2022 Jun 30. Vet Res Commun. 2022. PMID: 35771305 Free PMC article. Review.
References
-
- Bohonak AJ (1999) Dispersal, gene flow and population structure. Q Rev Biol 74: 21–45. - PubMed
-
- Belliure J, Sorci G, Møller AP, Clobert J (2000) Dispersal distances predict subspecies richness in birds. J Evolution Biol 13: 480–487.
-
- Clobert J, Danchin E, Dhondt AA, Nichols JD (2009) Informed dispersal, heterogeneity in animal dispersal syndromes and the dynamics of spatially structured populations. Ecol Lett 12: 197–209. - PubMed
-
- Greenwood PJ (1980) Mating systems, philopatry and dispersal in birds and mammals. Anim Behav 28: 1140–1162.
-
- Paradis E, Baillie SR, Sutherland WJ, Gregory RD (1998) Patterns of natal and breeding dispersal in birds. J Anim Ecol 67: 518–536.
Publication types
MeSH terms
LinkOut - more resources
Full Text Sources
Other Literature Sources
