. 2014 May 16;16(3):R113.
doi: 10.1186/ar4564.

Lysine-specific demethylase 1-mediated demethylation of histone H3 lysine 9 contributes to interleukin 1β-induced microsomal prostaglandin E synthase 1 expression in human osteoarthritic chondrocytes

Lysine-specific demethylase 1-mediated demethylation of histone H3 lysine 9 contributes to interleukin 1β-induced microsomal prostaglandin E synthase 1 expression in human osteoarthritic chondrocytes

Fatima Ezzahra El Mansouri et al. Arthritis Res Ther. .

Abstract

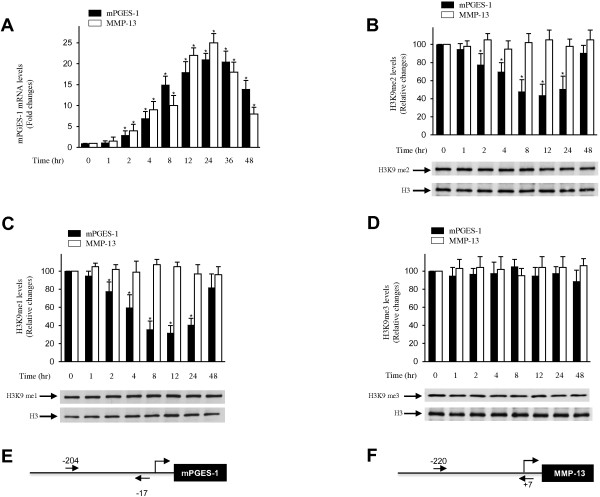
Introduction: Microsomal prostaglandin E synthase 1 (mPGES-1) catalyzes the terminal step in the biosynthesis of PGE2, a critical mediator in the pathophysiology of osteoarthritis (OA). Histone methylation plays an important role in epigenetic gene regulation. In this study, we investigated the roles of histone H3 lysine 9 (H3K9) methylation in interleukin 1β (IL-1β)-induced mPGES-1 expression in human chondrocytes.

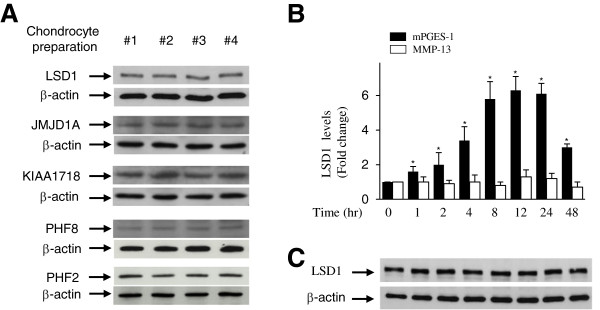
Methods: Chondrocytes were stimulated with IL-1β, and the expression of mPGES-1 mRNA was evaluated using real-time RT-PCR. H3K9 methylation and the recruitment of the histone demethylase lysine-specific demethylase 1 (LSD1) to the mPGES-1 promoter were evaluated using chromatin immunoprecipitation assays. The role of LSD1 was further evaluated using the pharmacological inhibitors tranylcypromine and pargyline and small interfering RNA (siRNA)-mediated gene silencing. The LSD1 level in cartilage was determined by RT-PCR and immunohistochemistry.

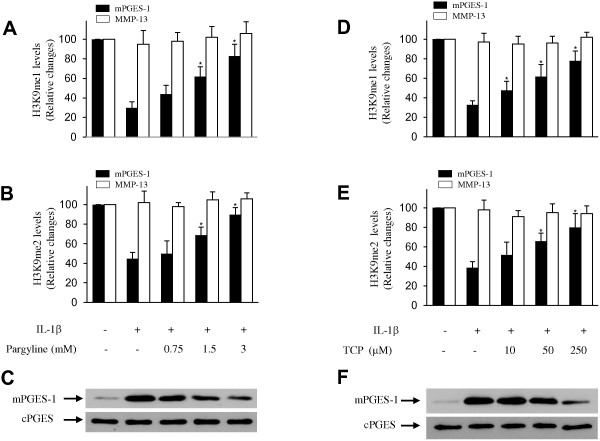
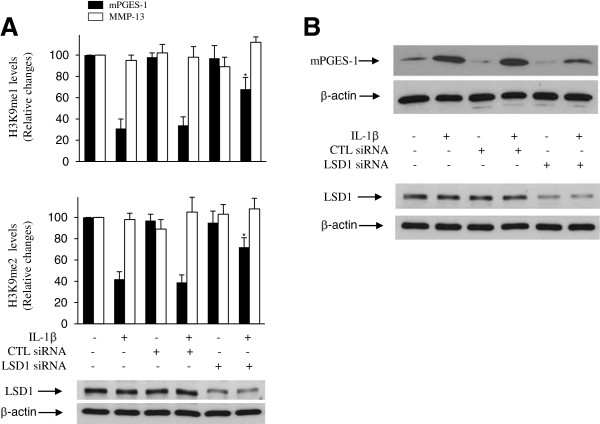
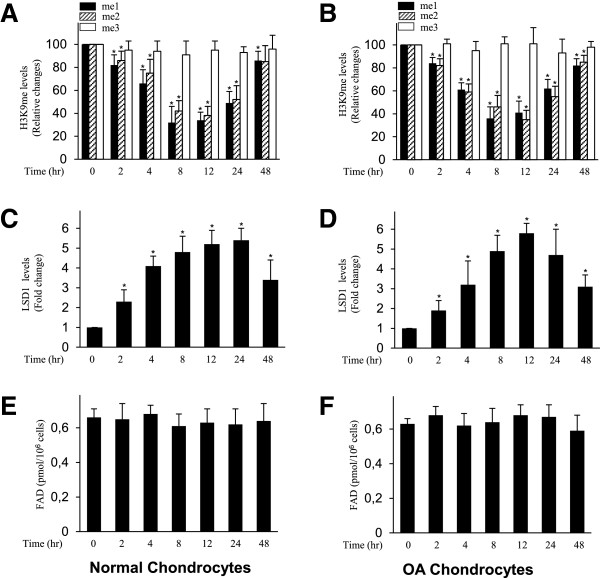
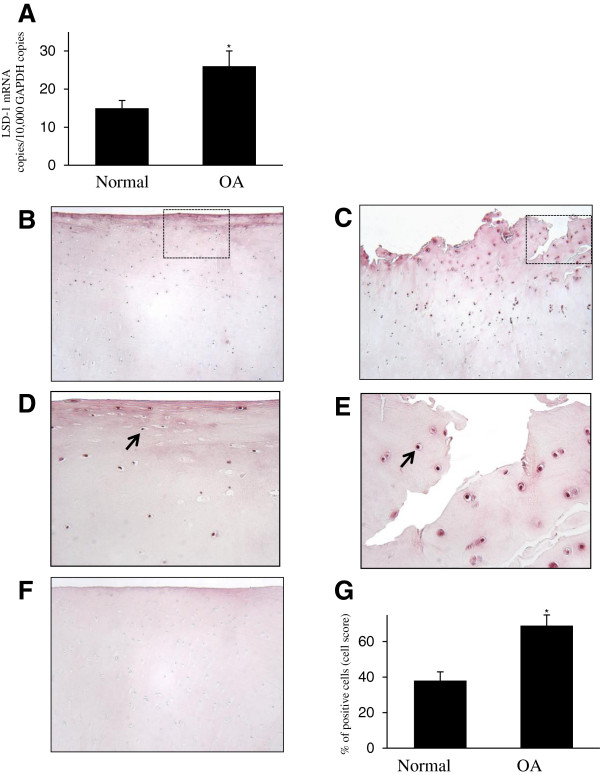
Results: The induction of mPGES-1 expression by IL-1β correlated with decreased levels of mono- and dimethylated H3K9 at the mPGES-1 promoter. These changes were concomitant with the recruitment of the histone demethylase LSD1. Treatment with tranylcypromine and pargyline, which are potent inhibitors of LSD1, prevented IL-1β-induced H3K9 demethylation at the mPGES-1 promoter and expression of mPGES-1. Consistently, LSD1 gene silencing with siRNA prevented IL-1β-induced H3K9 demethylation and mPGES-1 expression, suggesting that LSD1 mediates IL-1β-induced mPGES-1 expression via H3K9 demethylation. We show that the level of LSD1 was elevated in OA compared to normal cartilage.

Conclusion: These results indicate that H3K9 demethylation by LSD1 contributes to IL-1β-induced mPGES-1 expression and suggest that this pathway could be a potential target for pharmacological intervention in the treatment of OA and possibly other arthritic conditions.


Figures

Figure 1
Figure 1
Effect of interleukin 1β on histone H3 lysine 9 methylation at the microsomal prostaglandin E synthase 1 promoter. (A) Osteoarthritis (OA) chondrocytes were treated with 100 pg/ml interleukin 1β (IL-1β) for the indicated time periods. Total RNA was isolated, reverse-transcribed into cDNA, and microsomal prostaglandin E synthase 1 (mPGES-1), matrix metalloproteinase 13 (MMP-13) and glyceraldehyde 3-phosphate dehydrogenase mRNAs were quantified using real-time PCR. All experiments were performed in triplicate, and negative controls without template RNA were included in each experiment. The results are expressed as fold changes, assuming 1 as the value of untreated cells, and represent the mean ± SD of four independent experiments using cells from four different OA donors. *P < 0.05 compared with unstimulated cells. (B)- through (D) Confluent OA chondrocytes were treated with 100 pg/ml IL-1β for the indicated time periods. Chromatin immunoprecipitation (ChIP) assays, coupled with real-time PCR, were performed using antibodies specific to mono- (B), di- (C) and trimethylated (D) histone H3 lysine 9 (H3K9). me1, Monomethylation; me2, Dimethylation; me3, Trimethylation. The results are expressed as percentages of control values (that is, untreated cells) and are represent the mean ± SD of four independent experiments. For each ChIP assay, the immunoprecipitated DNA was quantitated in triplicate on two separate occasions. *P < 0.05 compared with unstimulated cells. The lower panels show chondrocytes that were treated as indicated. The levels of mono-, di- and trimethylated H3K9 and unmodified H3 were evaluated by immunoblotting. The blots are representative of similar results obtained in four independent experiments in which we used cells from four different OA donors. (E) and (F) Schematic diagrams of the mPGES-1 and MMP-13 promoters showing the locations of the PCR primers (arrows) used in the ChIP analyses.
Figure 2
Figure 2
Effect of interleukin 1β on the recruitment of lysine-specific demethylase 1 to the microsomal prostaglandin E synthase 1. A, nuclear extracts (20 μg) from four different osteoarthritis (OA) chondrocyte populations obtained from four different donors were studied by Western blot analysis and hybridized to antibodies specific to LSD1/KDM1, JMJD1A/JHDM2A/KDM3A, KIAA1718/JHDM1D/KDM7A, PHF8/JHDM1F/KDM7B and PHF2/JHDM1E/KDM7C. (B) Confluent OA chondrocytes were treated with 100 pg/ml interleukin 1β (IL-1β) for the indicated time periods, and chromatin immunoprecipitation (ChIP) assays were performed using a specific antibody against lysine-specific demethylase 1 (LSD1). The results are expressed as fold changes of LSD1 binding to the microsomal prostaglandin E synthase 1 (mPGES-1) or matrix metalloproteinase 13 (MMP-13) promoter relative to untreated cells and represent the mean ± SD of four independent experiments. *P < 0.05 compared with unstimulated cells. (C) Confluent OA chondrocytes were treated as described in part (B), and cell lysates were prepared and analyzed for LSD1 protein expression by Western blotting. In the lower panels, the blots were stripped and reprobed with a specific anti-β-actin antibody. The blots are representative of similar results obtained from four independent experiments using cells from four separate donors.
Figure 3
Figure 3
Effect of pargyline and tranylcypromine on interleukin 1β-induced histone H3 lysine 9 demethylation and microsomal prostaglandin E synthase 1 protein expression. Osteoarthritis (OA) chondrocytes were pretreated with control vehicle (dimethyl sulfoxide) or increasing concentrations of pargyline (A) through (C) and tranylcypromine (TCP) (D) through (F) for 1 hour prior to stimulation with 100 pg/ml interleukin 1β (IL-1β) for 8 hours (A, B, D and E) or 24 hours (C) and (F). (A), (B), (D) and (E) Chromatin immunoprecipitation (ChIP) assays, coupled with real-time PCR, were performed using antibodies specific to mono- and dimethylated histone H3 lysine 9 (H3K9). The results are expressed as the percentage of control values (that is, untreated cells) and represent the mean ± SD of four independent experiments. For each ChIP assay, the immunoprecipitated DNA was quantitated in triplicate on two separate occasions. *P < 0.05 compared with IL-1β-treated cells. TCP, tranylcypromine. (C) and (F) Cell lysates were prepared and analyzed for microsomal prostaglandin E synthase 1 (mPGES-1) protein expression by Western blotting. In the lower panels, the blots were stripped and reprobed with specific anti-β-actin antibody. The blots are representative of similar results obtained in four independent experiments using cells from four separate donors. cPGES, Cytosolic prostaglandin E synthase; me1, Monomethylation; me2, Dimethylation; me3, Trimethylation.
Figure 4
Figure 4
Effect of lysine-specific demethylase 1 silencing on interleukin 1β–induced histone H3 lysine 9 demethylation at microsomal prostaglandin E synthase 1 promoter. Osteoarthritis (OA) chondrocytes were transfected with 100 nM control scrambled small interfering RNA (siRNA) or lysine-specific demethylase 1 (LSD1). At 48 hours posttransfection, cells were left untreated or treated with 100 pg/ml interleukin 1β (IL-1β) for 8 hours (A) or 24 hours (B). CTL, Control. (A) Chromatin immunoprecipitation (ChIP) assays, coupled with real-time PCR, were performed using antibodies specific to mono- and dimethylated histone H3 lysine 9 (H3K9). The results are expressed as percentages of control values (that is, untreated cells), and the data are the mean ± SD of four independent experiments. For each ChIP assay, the immunoprecipitated DNA was quantitated in triplicate on two separate occasions. *P < 0.05 compared with nontransfected cells stimulated with IL-1β. (B) Cell lysates were prepared and analyzed for microsomal prostaglandin E synthase 1 (mPGES-1) protein expression by Western blotting. The blots were stripped and reprobed with specific anti-β-actin antibody. The blots are representative of similar results obtained from four independent experiments using cells from four separate donors. Knockdown of LSD1 was confirmed by Western blotting using a specific anti-LSD1 antibody (lower panels).
Figure 5
Figure 5
Effect of interleukin 1 on histone H3 lysine 9 methylation, lysine-specific demethylase 1 recruitment and flavin adenine dinucleotide levels in normal and osteoarthritis chondrocytes. Normal (A) and (C) and osteoarthritis (OA) (B) and (D) chondrocytes were treated with 100 pg/ml interleukin 1β (IL-1β) for the indicated time periods. Chromatin immunoprecipitation (ChIP) assays, coupled with real-time PCR, were performed using antibodies specific to mono-, di- and trimethylated histone H3 lysine 9 (H3K9) (A) and (B) and lysine-specific demethylase 1 (LSD1) (C) and (D). The results are expressed as percentages of control values (that is, untreated cells) or fold changes, and the data are the mean ± SD of three independent experiments using cells from three different donors. *P < 0.05 compared with unstimulated cells. Normal (E) and OA (F) chondrocytes were treated as indicated, and the levels of flavin adenine dinucleotide (FAD) were determined using a FAD assay kit. The results are expressed in picomolar units per 106 cells, and the data are the mean ± SD of three independent experiments using cells from three different donors. me1, Monomethylation; me2, Dimethylation; me3, Trimethylation.
Figure 6
Figure 6
Effect of interleukin 1β on histone H3 lysine 4 methylation at microsomal prostaglandin E synthase 1 promoter. Osteoarthritis (OA) chondrocytes were treated with 100 pg/ml interleukin 1β (IL-1β) for the indicated time periods, and chromatin immunoprecipitation (ChIP) assays were performed using antibodies specific to mono-, di- and trimethylated histone H3 lysine 4 (H3K4). The results are expressed as fold changes relative to control (that is unstimulated cells), and the data are the mean ± SD of three independent experiments using cells from four different donors. For each ChIP assay, the immunoprecipitated DNA was quantitated in triplicate on two separate occasions. *P < 0.05 compared with unstimulated cells. me1, Monomethylation; me2, Dimethylation; me3, Trimethylation.
Figure 7
Figure 7
Expression of lysine-specific demethylase 1 protein in human normal and osteoarthritis cartilage. (A) RNA was extracted from normal cartilage (n = 10) and osteoarthritis (OA) cartilage (n = 10), reverse-transcribed into cDNA and processed for real-time PCR. The threshold cycle values were converted to the number of molecules. The data are expressed as copies of the gene’s mRNA detected per 10,000 glyceraldehyde 3-phosphate dehydrogenase (GAPDH) copies. *P < 0.05 versus normal samples. Representative immunostained images of human normal cartilage (B) and OA cartilage (C) for lysine-specific demethylase 1 (LSD1) protein are shown. (D) and (E) Higher-magnification views of the areas within the rectangles in (B) and (C), respectively. The arrow shows postitive expression of LSD1. (F) Cartilage specimens treated with the anti-LSD1 antibody that was preadsorbed with a 20-fold molar excess of the protein fragment corresponding to amino acids 834 to 852 of human LSD1 protein (control for staining specificity). (G) Percentage of chondrocytes expressing LSD1 in normal and OA cartilage. The data are the mean ± SD of 10 normal and 10 OA specimens. *P < 0.05 versus normal cartilage.

Similar articles

Cited by

References

    1. Lawrence RC, Helmick CG, Arnett FC, Deyo RA, Felson DT, Giannini EH, Heyse SP, Hirsch R, Hochberg MC, Hunder GG, Hunder GG, Liang MH, Pillemer SR, Steen VD, Wolfe F. Estimates of the prevalence of arthritis and selected musculoskeletal disorders in the United States. Arthritis Rheum. 1998;41:778–799. doi: 10.1002/1529-0131(199805)41:5<778::AID-ART4>3.0.CO;2-V. - DOI - PubMed
    1. Loeser RF, Goldring SR, Scanzello CR, Goldring MB. Osteoarthritis: a disease of the joint as an organ. Arthritis Rheum. 2012;64:1697–1707. doi: 10.1002/art.34453. - DOI - PMC - PubMed
    1. Goldring MB, Otero M. Inflammation in osteoarthritis. Curr Opin Rheumatol. 2011;23:471–478. doi: 10.1097/BOR.0b013e328349c2b1. - DOI - PMC - PubMed
    1. O’Keefe RJ, Crabb ID, Puzas JE, Rosier RN. Influence of prostaglandins on DNA and matrix synthesis in growth plate chondrocytes. J Bone Miner Res. 1992;7:397–404. doi: 10.1002/jbmr.5650071406. - DOI - PubMed
    1. Amin AR, Attur M, Patel RN, Thakker GD, Marshall PJ, Rediske J, Stuchin SA, Patel IR, Abramson SB. Superinduction of cyclooxygenase-2 activity in human osteoarthritis-affected cartilage. Influence of nitric oxide. J Clin Invest. 1997;99:1231–1237. doi: 10.1172/JCI119280. - DOI - PMC - PubMed

MeSH terms

LinkOut - more resources