. 2014 May 22;16(3):R115.
doi: 10.1186/ar4567.

Type 1 regulatory T cells specific for collagen type II as an efficient cell-based therapy in arthritis

Type 1 regulatory T cells specific for collagen type II as an efficient cell-based therapy in arthritis

Hélène Asnagli et al. Arthritis Res Ther. .

Abstract

Introduction: Regulatory T (Treg) cells play a crucial role in preventing autoimmune diseases and are an ideal target for the development of therapies designed to suppress inflammation in an antigen-specific manner. Type 1 regulatory T (Tr1) cells are defined by their capacity to produce high levels of interleukin 10 (IL-10), which contributes to their ability to suppress pathological immune responses in several settings. The aim of this study was to evaluate the therapeutic potential of collagen type II-specific Tr1 (Col-Treg) cells in two models of rheumatoid arthritis (RA) in mice.

Methods: Col-Treg clones were isolated and expanded from collagen-specific TCR transgenic mice. Their cytokine secretion profile and phenotype characterization were studied. The therapeutic potential of Col-Treg cells was evaluated after adoptive transfer in collagen-antibody- and collagen-induced arthritis models. The in vivo suppressive mechanism of Col-Treg clones on effector T-cell proliferation was also investigated.

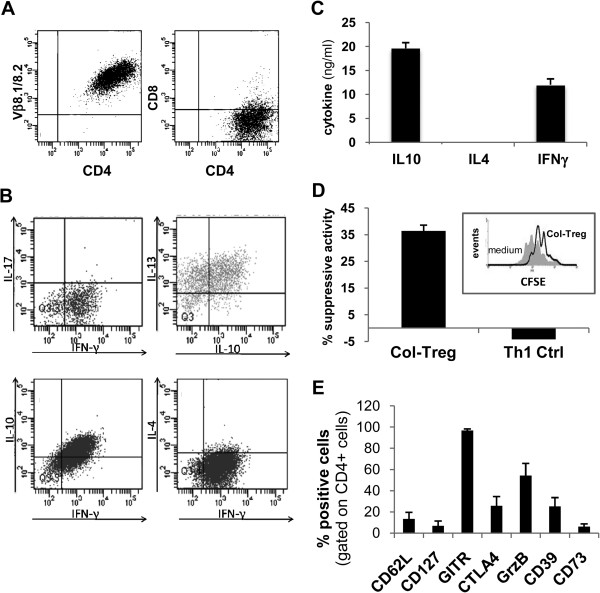
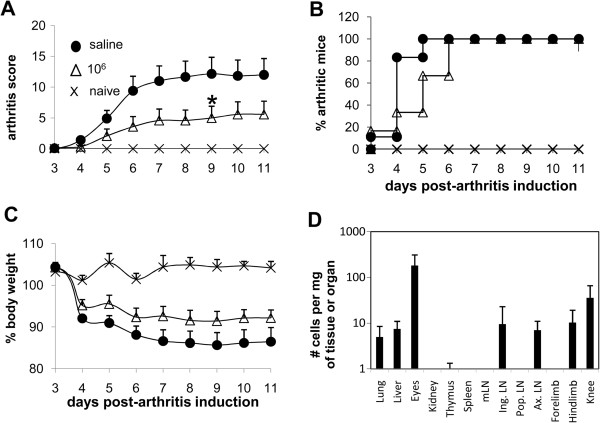
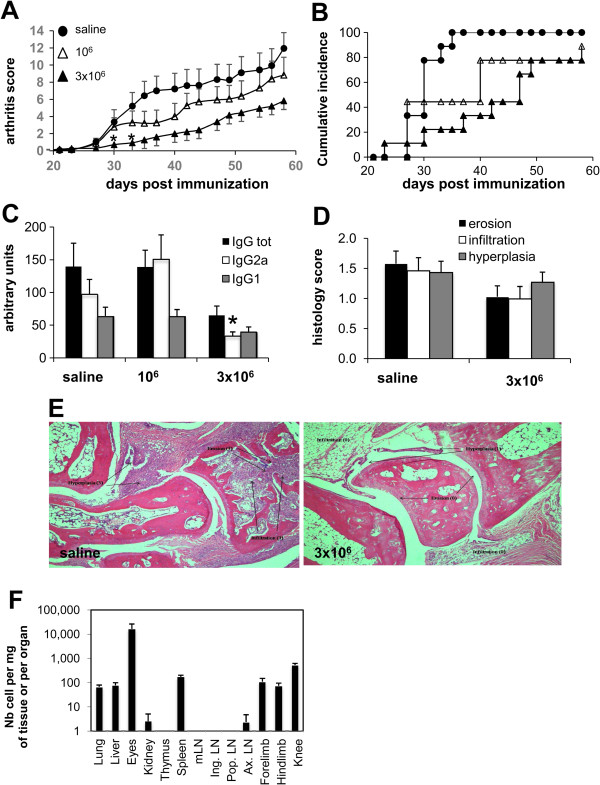
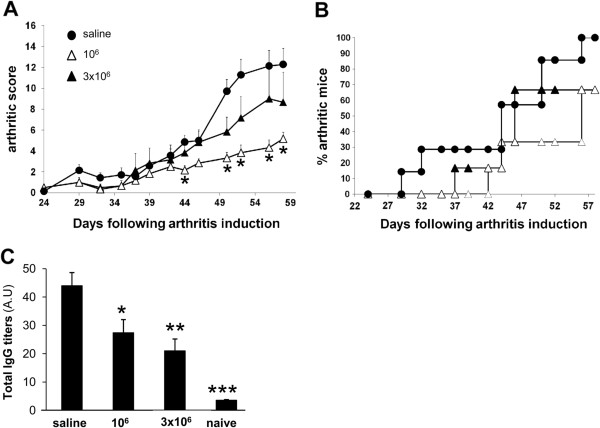
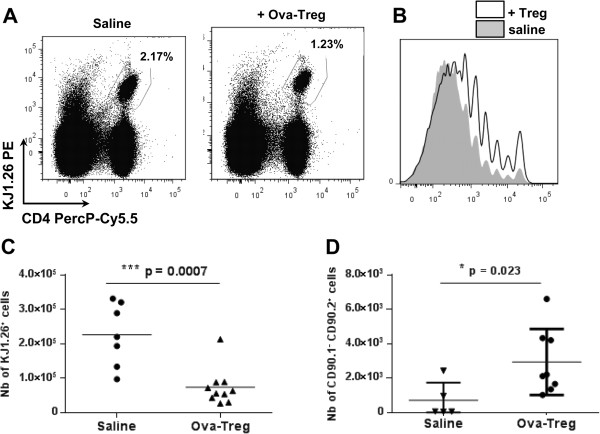
Results: Col-Treg clones are characterized by their specific cytokine profile (IL-10(high)IL-4(neg)IFN-γ(int)) and mediate contact-independent immune suppression. They also share with natural Tregs high expression of GITR, CD39 and granzyme B. A single infusion of Col-Treg cells reduced the incidence and clinical symptoms of arthritis in both preventive and curative settings, with a significant impact on collagen type II antibodies. Importantly, injection of antigen-specific Tr1 cells decreased the proliferation of antigen-specific effector T cells in vivo significantly.

Conclusions: Our results demonstrate the therapeutic potential of Col-Treg cells in two models of RA, providing evidence that Col-Treg could be an efficient cell-based therapy for RA patients whose disease is refractory to current treatments.


Figures

Figure 1
Figure 1
Phenotypic characterization of the collagen type II–specific type 1 regulatory T cell clones. (A) Graphed data of representative fluorescence-activated cell-sorting (FACS) analysis of the selected clones for the expression of T-cell receptor Vβ8 and CD4. (B) Graph illustrating the results of representative FACS analysis of intracellular cytokine staining of collagen type II–specific type 1 regulatory T cell (Col-Treg) clones following 4 hours of polyclonal stimulation. IFN, Interferon; IL, Interleukin. (C) Graph showing the cytokine secretion profile of three representative Col-Treg clones. The cytokine levels were quantified by enzyme-linked immunosorbent assay in the culture supernatants after 48 hours of polyclonal stimulation. The data are expressed as mean ± SEM. (D) Graph describing the immunosuppressive activity of Col-Treg clones, measured in a cell contact–independent assay by carboxyfluorescein diacetate succinimidyl ester (CFSE) dilution, after 3 days of coculture with freshly isolated splenocytes stimulated with anti-CD3 antibody. The data are representative of at least seven clones. Th1, Type 1 T helper cell. (E) Graph of the expression levels of several phenotypic markers following 24 hours of polyclonal stimulation. Values are mean ± SEM of the percentage of positive cells for each marker. The data are representative of three to eighteen clones.
Figure 2
Figure 2
Single administration of collagen type II–specific type 1 regulatory T cell cells reduces acute collagen-antibody-induced arthritis. We administered intraperitoneal injections of lipopolysaccharide (100 μg) into DBA/1 mice at day 3 after arthritis induction, followed 2 to 4 hours later by intravenous injections of 1 × 106 collagen type II–specific type 1 regulatory T cell (Col-Treg) clones (open triangles; n = 6) or saline buffer solution (closed circles; n = 6). Mice not injected with antibody were used as controls (X’s; n = 2). After T-cell infusion, the mice were evaluated daily for clinical signs of arthritis. (A) Graphed mean ± SEM data of the severity scores of arthritic mice are shown. Differences were analyzed by nonparametric Mann–Whitney U test. The data are representative of two independent experiments. *P < 0.05 with 95% confidence interval for comparison of arthritic and saline-injected control mice. (B) Disease incidence represents the percentage of arthritic mice at each time point. (C) Percentages of body weight loss are shown. (D) Graph illustrating the trafficking of type 1 regulatory T cell clones analyzed 24 hours after intravenous infusion of 1 × 106 cells in collagen antibody–induced arthritis mice (n = 6). The data are expressed as mean ± SEM of the number of transgenic positive cells detected in various organs, including joint tissues, determined by quantitative PCR using standard curves. LN, Lymph node. mLN, Mesentheric LN. Ing. LN, Inguinal LN. Pop. LN, Popliteal LN. Ax. LN, Axillary LN.
Figure 3
Figure 3
Decrease of inflammation, bone erosion and B-cell response following injection of collagen type II–specific type 1 regulatory T cells at day 20 in murine collagen-induced arthritis. In the DBA/1 mice, we administered intravenous injections of collagen type II–specific type 1 regulatory T cell (Col-Treg) clones in quantities of 1 × 106 (open triangles; n = 9) or 3 × 106 (closed triangles; n = 9) or saline buffer solution (closed circles; n = 9) at day 20 postimmunization. After the T-cell infusions, the mice were clinically monitored every other day. (A) Graphed mean ± SEM data of the arthritis severity scores are shown. Differences were analyzed by nonparametric Mann–Whitney U test (*P < 0.05 with 95% confidence interval represent statistically significant differences between the arthritic and saline-injected mice). (B) The disease incidence in each group of mice is shown. (C) Bovine collagen II–specific total immunoglobulin G (IgG), IgG1 and IgG2a levels in sera collected at the time mice were killed. Values expressed in arbitrary units are mean ± SEM. Asterisk represents a significant difference between arthritic and saline-injected mice. (D) At the time mice were killed, tissue sections were taken from the hind paws and forepaws for histological staining and scored for erosion, infiltration and hyperplasia. The values shown are mean ± SEM of each paw from nine mice per group. (E) Representative images of histological sections of hind paws stained with hematoxylin and eosin in control mice (left panel) or Col-Treg–treated mice (right panel). Arrows indicate hyperplasia, inflammation or erosion. Original magnification of both images = 40×. (F) Trafficking of type 1 Treg clones was analyzed 24 hours after intravenous retro-orbital infusion of 3 × 106 Treg cells in various organs, including joint tissues (n = 9). LN, Lymph node. Nb, Number. mLN, Mesentheric LN. Ing. LN, Inguinal LN. Pop. LN, Popliteal LN. Ax. LN, Axillary LN.
Figure 4
Figure 4
Collagen type II–specific type 1 regulatory T cells reduce the severity of ongoing collagen-induced arthritis. At day 28 after induction of arthritis, bovine collagen II–immunized DBA/1 mice received injections of either 1 or 3 × 106 collagen type II–specific type 1 regulatory T (Col-Treg) cells, and clinical and biological monitoring of arthritis were continued until day 56. (A) Graphed mean ± SEM data of arthritis severity scores from day 24 of saline-injected mice (closed circles; n = 7) or mice injected with 3 × 106 Col-Treg cells (closed triangles; n = 6) or 1 × 106 Col-Treg cells (open triangles; n = 6). *P < 0.05 (Mann–Whitney U test) indicates statistically significant difference in severity scores between mice injected with Col-Treg cells vs. saline buffer. (B) Graph describing disease incidence in each group of mice. (C) Bovine collagen II–specific total immunoglobulin G (IgG) levels in sera collected at the time the mice were killed. Values are expressed in arbitrary units (A.U) and represent the mean ± SEM. Similar results were obtained in three independent experiments. Asterisks represent statistically significant differences in IgG levels between arthritic mice and mice injected with saline buffer. Differences were analyzed by Mann–Whitney U test (*P < 0.05, **P < 0.005, ***P < 0.0005 with 95% confidence intervals).
Figure 5
Figure 5
Antigen-specific type 1 regulatory T cells dampen the proliferation of effector T cells. BALB/c mice received injections of carboxyfluorescein diacetate succinimidyl ester (CFSE)–labeled, ovalbumin (ova)-specific effector CD4+ cells on the day before subcutaneous immunization with a mixture of ovalbumin and incomplete Freund’s adjuvant. At day 5, either phosphate-buffered saline (PBS) (n = 7) or 1 × 106 ova-specific type 1 regulatory T (ova-Treg) cells (n = 10) were injected intravenously. The mice received ova injections into their hind paws. Two days afterward, the proliferation of CFSE+KJ1.26+ cells was analyzed by flow cytometry. (A) Representative staining results for KJ1.26+ effector T cells in the draining lymph nodes (DLNs) are graphed. (B) Representative CFSE dilution due to the proliferation of effector KJ1.26+ T cells was analyzed using FlowJo software (TreeStar, Ashland, OR, USA). Graph shows the same numbers of CD4+KJ1.26+ cells isolated from mice that received injections of saline (gray) or ova-Treg cells (bold). (C) Graphed numbers of KJ1.26+ proliferating cells in the DLNs. (D) CD90.1 congenic BALB/c mice received injections of CFSE-labeled, ova-specific effector CD4+ cells and 1 × 107 ova-Treg cells (n = 8) or PBS (n = 5). The numbers of ova-Treg cells (CD90.2+) in the DLNs are shown. Differences were analyzed by Mann–Whitney U test with 95% confidence intervals.

Similar articles

Cited by

References

    1. Arend WP, Dayer JM. Inhibition of the production and effects of interleukin-1 and tumor necrosis factor α in rheumatoid arthritis. Arthritis Rheum. 1995;38:151–160. doi: 10.1002/art.1780380202. - DOI - PubMed
    1. Feldmann M, Brennan FM, Williams RO, Woody JN, Maini RN. The transfer of a laboratory based hypothesis to a clinically useful therapy: the development of anti-TNF therapy of rheumatoid arthritis. Best Pract Res Clin Rheumatol. 2004;18:59–80. doi: 10.1016/j.berh.2003.09.010. - DOI - PubMed
    1. Anderson PJ. Tumor necrosis factor inhibitors: clinical implications of their different immunogenicity profiles. Semin Arthritis Rheum. 2005;34:19–22. doi: 10.1016/j.semarthrit.2005.01.005. - DOI - PubMed
    1. Bartelds GM, Wijbrandts CA, Nurmohamed MT, Stapel S, Lems WF, Aarden L, Dijkmans BA, Tak PP, Wolbink GJ. Clinical response to adalimumab: relationship to anti-adalimumab antibodies and serum adalimumab concentrations in rheumatoid arthritis. Ann Rheum Dis. 2007;66:921–926. doi: 10.1136/ard.2006.065615. - DOI - PMC - PubMed
    1. Svenson M, Geborek P, Saxne T, Bendtzen K. Monitoring patients treated with anti-TNF-α biopharmaceuticals: assessing serum infliximab and anti-infliximab antibodies. Rheumatology (Oxford) 2007;46:1828–1834. doi: 10.1093/rheumatology/kem261. - DOI - PubMed

Publication types

MeSH terms

LinkOut - more resources