. 2014 Jun 2;9(6):e97144.
doi: 10.1371/journal.pone.0097144. eCollection 2014.

The diacylglycerol kinase α/atypical PKC/β1 integrin pathway in SDF-1α mammary carcinoma invasiveness

Affiliations

The diacylglycerol kinase α/atypical PKC/β1 integrin pathway in SDF-1α mammary carcinoma invasiveness

Elena Rainero et al. PLoS One. .

Abstract

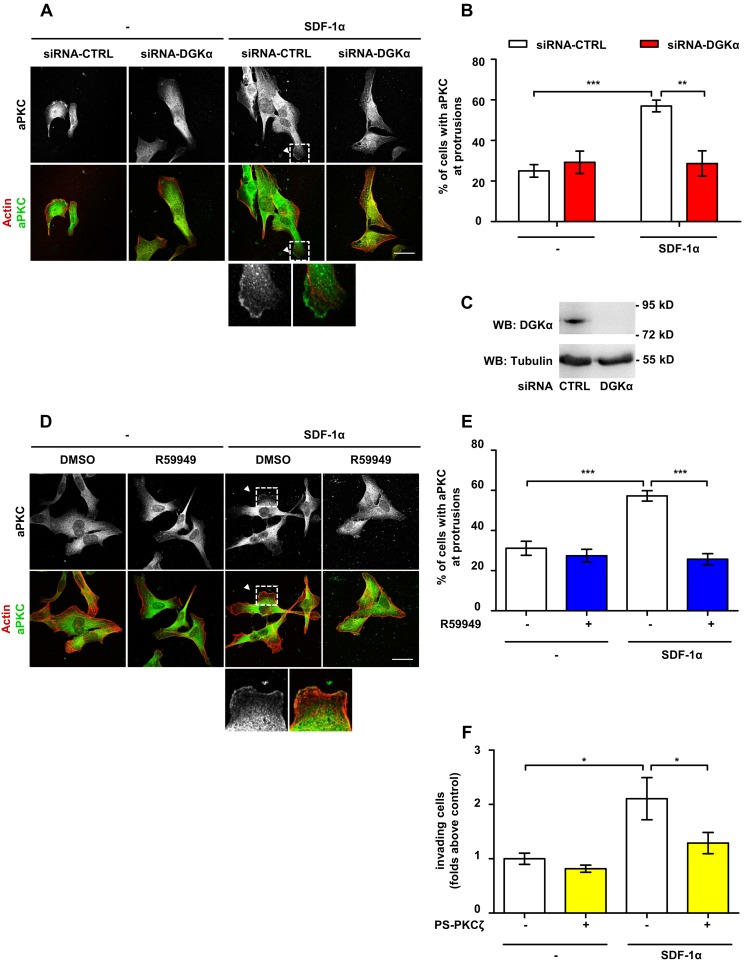
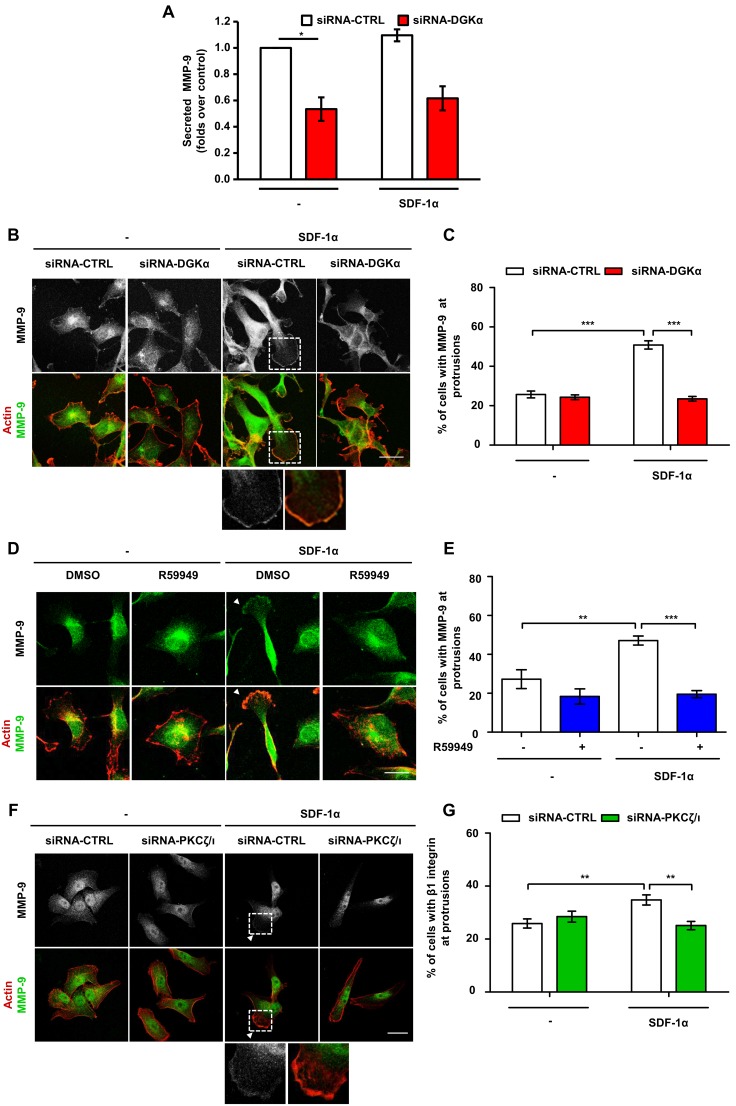
Diacylglycerol kinase α (DGKα), by phosphorylating diacylglycerol into phosphatidic acid, provides a key signal driving cell migration and matrix invasion. We previously demonstrated that in epithelial cells activation of DGKα activity promotes cytoskeletal remodeling and matrix invasion by recruiting atypical PKC at ruffling sites and by promoting RCP-mediated recycling of α5β1 integrin to the tip of pseudopods. In here we investigate the signaling pathway by which DGKα mediates SDF-1α-induced matrix invasion of MDA-MB-231 invasive breast carcinoma cells. Indeed we showed that, following SDF-1α stimulation, DGKα is activated and localized at cell protrusion, thus promoting their elongation and mediating SDF-1α induced MMP-9 metalloproteinase secretion and matrix invasion. Phosphatidic acid generated by DGKα promotes localization at cell protrusions of atypical PKCs which play an essential role downstream of DGKα by promoting Rac-mediated protrusion elongation and localized recruitment of β1 integrin and MMP-9. We finally demonstrate that activation of DGKα, atypical PKCs signaling and β1 integrin are all essential for MDA-MB-231 invasiveness. These data indicates the existence of a SDF-1α induced DGKα - atypical PKC - β1 integrin signaling pathway, which is essential for matrix invasion of carcinoma cells.


Conflict of interest statement

Competing Interests: The authors have declared that no competing interests exist.

Figures

Figure 1
Figure 1. DGKα is necessary for SDF-1α-induced cell invasion.
MDA-MB-231 cells were infected with lentiviral vectors expressing an inducible shRNA against DGKα (shRNA-DGKα1) or an inducible control shRNA (shRNA-CTRL). Parental and infected cells were treated with 1 µg/ml doxycycline for 72 hours to promote shRNA transcription. A) 50,000 cells were plated on matrigel invasion chamber and incubated for 24 hours in presence or in absence of SDF-1α (100 ng/ml). Histogram reports mean ± SE of fold over control values from 3 independent experiments with *t-test p<0.05, **t-test p<0.01. B) The efficiency of DGKα down–regulation by shRNA was verified by quantitative RT-PCR. **t-test p<0.01. A) Cells were lysed and the efficiency of DGKα down–regulation by shRNA was verified by western blot, tubulin was used as a loading control.
Figure 2
Figure 2. SDF-1α stimulates DGKα activity and localization at protrusions site.
A) MDA-MB-231 cells, stably expressing myc-DGKα, were plated on matrigel-coated coverslips for 20 hours in FCS containing medium and cultured for further 20 hours in serum free medium. Cells were then stimulated with 50 ng/ml of SDF-1α for the indicated times, fixed and stained for actin (red) and myc-DGKα (green). Representative images at 4 hours after stimulation. Arrowheads indicate DGKα at protrusions. Histogram (B) reports the percentage of cells displaying myc-DGKα at protrusion as mean ± SE of 5 independent experiments, *t-test p<0.05, **t-test p<0.005. Scale bar 24 µm. C) MDA-MB-231 cells were infected with a lentiviral vector expressing inducible OST-tagged DGKα or an empty vector. To induce DGKα expression, cells were treated overnight with doxycycline (1 µg/ml) in serum free medium. Cell were homogenized with buffer B in absence of detergent and analysed for DGK activity (upper panel). Values are mean ± SE of 4 independent experiments with *t-test p<0.05. OST-DGKα and actin protein expression was verified by anti-OST and anti-actin western blot (lower panel).
Figure 3
Figure 3. DGKα mediates SDF-1α-induced cell invasion by regulating aPKCs recruitment to cell pseudopods.
A) MDA-MB-231 cells were plated on matrigel-coated coverslips for 20 hours in FCS containing medium, transfected with CTRL or DGKα –specific siRNA and cultured for further 20 hours in serum free medium. Cells were then stimulated for 6 hours with 50 ng/ml SDF-1α, fixed, and stained for actin (red) and aPKCs (green). Arrowhead indicates aPKCs at protrusions. Scale bar 24 µm. B) Histogram reports the percentage of cells displaying aPKCs at protrusions as mean ± SE of 3 independent experiments with **t-test p<0.005, ***t-test p<0.0005. C) MDA-MB-231 cells were transfected with CTRL or DGKα –specific siRNA and lysed. The efficiency of DGKα down–regulation by siRNA was verified at 48 hours after transfection by western blot, tubulin was used as loading control. D) MDA-MB-231 cells were plated on matrigel-coated coverslips for 20 hours in FCS containing medium and cultured for further 20 hours in serum free medium. Cells were then stimulated for 6 hours with 50 ng/ml SDF-1α, in presence or in absence of 1 µM R59949, fixed and stained for actin (red) and aPKCs (green). Arrowheads indicate aPKCs at protrusions. Scale bar 24 µm. E) Histogram reports the percentage of cells displaying aPKCs at protrusions as mean ± SE of 3 independent experiments with ***t-test p<0.0005. F) MDA-MB-231 cells (106/well) were plated on matrigel invasion chamber and stimulates for 24 hours with SDF-1α (50 ng/ml) in presence or absence of PKCζ pseudosubstrate (PS-PKCζ, 10 µM). Histogram reports mean ± SE of folds over control values from 3 independent experiments with *t-test p<0.05.
Figure 4
Figure 4. DGKα and aPKCs mediate SDF-1α-induced recruitment of β1 integrin to pseudopods.
A) MDA-MB-231 cells were plated on matrigel-coated coverslips for 20 hours in FCS containing medium, transfected with CTRL or DGKα–specific siRNA and cultured for further 20 hours in serum free medium. Cells were then stimulated for 6 hours with 50 ng/ml SDF-1α, fixed and stained for actin (red) and β1 integrin (green). Arrows indicate β1 integrin at protrusions. Scale bar 24 µm. B) Histogram reports the percentage of cells displaying β1 integrin at protrusions as mean ± SE values of 3 independent experiments with **t-test p<0.005. C) MDA-MB-231 cells were plated on matrigel-coated coverslips for 20 hours in FCS containing medium and cultured for further 20 hours in serum free medium. Cells were then stimulated for 6 hours with 50 ng/ml SDF-1α, in presence or in absence of 1 µM R59949, fixed and stained for actin (red) and β1 integrin (green). Arrow indicates β1 integrin at protrusions. Scale bar 24 µm. D) Histogram reports the percentage of cells displaying β1 integrin at protrusions as mean ± SE of 3 independent experiments with *t-test p<0.05, **t-test p<0.005. E) MDA-MB-231 cells were plated on matrigel-coated coverslips for 20 hours in FCS containing medium, transfected with CTRL or PKCζ/ι –specific siRNA and cultured for further 20 hours in serum free medium. Cells were then stimulated for 6 hours with 50 ng/ml SDF-1α, fixed and stained for actin (red) and β1 integrin (green). Arrowheads indicate β1 integrin at protrusions. Scale bar 24 µm. F) Histogram reports the percentage of cells displaying β1 integrin at protrusions as mean ± SE of 3 independent experiments with **t-test p<0.005. G) MDA-MB-231 cells were transfected with CTRL and PKCζ/ι –specific siRNA and lysed. The efficiency of PKCζ/ι down–regulation by siRNA was verified by western bloting, tubulin was used as a loading control. H) MDA-MB-231 cells were infected with lentiviral vectors expressing a shRNA against β1-integrin (shRNA-β1) or a control sequence (shRNA-CTRL). 50,000 cells were plated on matrigel invasion chamber and incubated for 24 hours in presence or in absence of SDF-1α (100 ng/ml). Histogram reports mean ± SE of fold over control values from 3 independent experiments with *t-test p<0.05, **t-test p<0.01. I) The efficiency of β1-integrin down–regulation by shRNA was verified by quantitative RT-PCR.
Figure 5
Figure 5. DGKα and aPKCs mediates MMP-9 secretion and localization at protrusions.
A) MDA-MB-231 cells were transfected with CTRL or DGKα –specific siRNA and shifted to serum free media. After 24 hours cells were treated with 100 ng/ml SDF-1α in serum free medium for further 20 hours. MMP9 content in the supernatants was measured by ELISA assay, histogram reports secreted MMP-9 as mean ± SE of 3 independent experiments normalized for control, with *t-test p<0.05. B) MDA-MB-231 cells were plated on matrigel-coated coverslips for 20 hours in FCS containing medium, transfected with CTRL or DGKα –specific siRNA and cultured for further 20 hours in serum free medium. Cells were stimulated for 6 hours with 50 ng/ml SDF-1α, fixed and stained for actin (red) and MMP-9 (green). Arrowhead indicates MMP-9 at protrusions. Scale bar 24 µm. C) Histogram reports the percentage of cells displaying MMP-9 at protrusions as mean ± SE of 3 independent experiments with ***t-test p<0.0005. D) MDA-MB-231 cells were plated on matrigel-coated coverslips for 20 hours in FCS containing medium and cultured for further 20 hours serum free medium. Cells were stimulated for 6 hours with 50 ng/ml SDF-1α, in presence or in absence of 1 µM R59949, fixed and stained for actin (red) and MMP-9 (green). Arrowhead indicates MMP-9 at protrusions. Scale bar 24 µm. E) Histogram reports the percentage of cells displaying MMP-9 at protrusions as mean ± SE of 3 independent experiments with **t-test p<0.005, ***t-test p<0.01. F) MDA-MB-231 cells were plated on matrigel-coated coverslips for 20 hours in FCS containing medium, transfected with CTRL or PKCζ/ι –specific siRNA and cultured for further 20 hours in serum free medium. Cells were then stimulated for 6 hours with 50 ng/ml SDF-1α, fixed and stained for actin (red) and MMP-9 (green). Arrowhead indicates MMP-9 at protrusions. Scale bar 24 µm. G) Histogram reports the percentage of cells displaying MMP-9 at protrusions as mean ± SE of 3 independent experiments with *t-test p<0.05, **t-test p<0.005.
Figure 6
Figure 6. DGKα overexpression promotes a PKC-dependent cell elongation.
MDA-MB-231 cells were infected with lentiviral vector expressing inducible OST-tagged DGKα or an empty vector. To induce DGKα expression, cells were treated overnight with doxycycline (1 µg/ml) in serum free medium. A) After cell lysis OST-DGKα induction was verified by western blotting with an antibody recognizing the OST-tag, while the extent of overexpression was verified with anti DGKα antibodies. Tubulin was used as loading control. B) Phase contrast images of control and OST-DGKα cells cultured in presence or absence of doxycycline. Arrows indicate cells with long protrusions. Scale bar 50 µm. C) Confocal images of doxycycline induced cells showing OST-DGKα localization, cells were stained for actin (red) and OST (green). Scale bar 24 µm. D) Time course of cell elongation at 2, 10 and 18 hours with or without doxycycline treatment. Time lapse videos were recorded and total cell length measured. Box and whiskers plots (black lines show median, whiskers: 5–95 percentile) of data from 3 independent experiments are shown, ***p<0.0001, 1 way ANOVA. E) MDA-MB-231 cells expressing OST-DGKα were transiently transfected with control or PKCζ/ι-specific siRNA. After 48 hours DGKα expression was induced by overnight treatment with doxycycline (1 µg/ml) in serum free medium. Images were acquired with a phase contrast microscope, representative images are shown. Scale bar 50 µm. Total cell length was measured for at least 100 cells and reported as box and whiskers plot. F) MDA-MB-231 cells expressing OST-DGKα were induced by overnight treatment with doxycycline (1 µg/ml) in serum free medium with or without NSC23766 (100 µM). Images were acquired with a phase contrast microscope, representative images are shown. Scale bar 50 µm. Total cell length was measured for at least 100 cells and reported as box and whiskers plot. MDA-MB-231 cells were transfected with CTRL and PKCζ/ι –specific siRNA and lysed. The efficiency of PKCζ/ι down–regulation by siRNA was verified by western blotting, tubulin was used as a loading control.

Similar articles

Cited by

References

    1. Müller A, Homey B, Soto H, Ge N, Catron D, et al. (2001) Involvement of chemokine receptors in breast cancer metastasis. Nature 410: 50–56. - PubMed
    1. Korkaya H, Liu S, Wicha MS (2011) Breast cancer stem cells, cytokine networks, and the tumor microenvironment. J Clin Invest 121: 3804–3809. - PMC - PubMed
    1. Teicher BA, Fricker SP (2010) CXCL12 (SDF-1)/CXCR4 pathway in cancer. Clin Cancer Res 16: 2927–2931. - PubMed
    1. Burger JA, Kipps TJ (2006) CXCR4: a key receptor in the crosstalk between tumor cells and their microenvironment. Blood 107: 1761–1767. - PubMed
    1. Li H, Yang L, Fu H, Yan J, Wang Y, et al. (2013) Association between Gαi2 and ELMO1/Dock180 connects chemokine signalling with Rac activation and metastasis. Nat Commun 4: 1706. - PMC - PubMed

Publication types

MeSH terms