. 2014 May 9:2:53.
doi: 10.1186/2051-5960-2-53.

Complement activation in multiple sclerosis plaques: an immunohistochemical analysis

Affiliations

Complement activation in multiple sclerosis plaques: an immunohistochemical analysis

Gillian Ingram et al. Acta Neuropathol Commun. .

Abstract

Introduction: Inflammation and complement activation are firmly implicated in the pathology of multiple sclerosis; however, the extent and nature of their involvement in specific pathological processes such as axonal damage, myelin loss and disease progression remains uncertain. This study aims to bring clarity to these questions.

Results: We describe a detailed immunohistochemical study to localise a strategically selected set of complement proteins, activation products and regulators in brain and spinal cord tissue of 17 patients with progressive multiple sclerosis and 16 control donors, including 9 with central nervous system disease. Active, chronic active and chronic inactive multiple sclerosis plaques (35 in total) and non-plaque areas were examined.Multiple sclerosis plaques were consistently positive for complement proteins (C3, factor B, C1q), activation products (C3b, iC3b, C4d, terminal complement complex) and regulators (factor H, C1-inhibitor, clusterin), suggesting continuing local complement synthesis, activation and regulation despite the absence of other evidence of ongoing inflammation. Complement staining was most apparent in plaque and peri-plaque but also present in normal appearing white matter and cortical areas to a greater extent than in control tissue. C1q staining was present in all plaques suggesting a dominant role for the classical pathway. Cellular staining for complement components was largely restricted to reactive astrocytes, often adjacent to clusters of microglia in close apposition to complement opsonised myelin and damaged axons.

Conclusions: The findings demonstrate the ubiquity of complement involvement in multiple sclerosis, suggest a pathogenic role for complement contributing to cell, axon and myelin damage and make the case for targeting complement for multiple sclerosis monitoring and therapy.


Figures
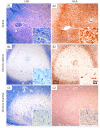
Figure 1
Figure 1
Plaque morphology in MS cases. Paraffin wax sections stained with LFB (A1, B1 and C1) and anti-HLA DR (A2, B2 and C2) showing an active (A1-A2; case MS160_S3), chronic active (B1-B2; case MS225_S13) and chronic inactive plaque (C1-C2; case MS61_B). The active plaque shows profound inflammation with anti-HLA-DR immunopositive microglia (A2 and inset) and foamy macrophages containing myelin degradation products demonstrated using LFB (inset in A1). The chronic active plaque shows little inflammation in the centre of the plaque (insets in B1 and B2) but abundant anti-HLA-DR immunopositive microglial at the plaque border (B2). The chronic inactive plaque shows an immunologically silent lesion centre (inset in C1 and C2) and a well demarcated lesion border showing only mild inflammation (C2 and inset) Scale bars are shown in B2 and are applicable for all plates and inserts.
Figure 2
Figure 2
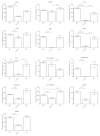
Quantitation of cell immunolabelling. Quantitative cellular immunolabelling in brain and spinal cord tissue from multiple sclerosis (MS; 17 cases with 690 areas examined from 42 sections), non-neurological controls (Controls; 7 cases with 140 areas examined from 14 sections) and neurological controls (NC; 9 cases with 110 areas examined from 11 sections). Groups show total mean values from all areas examined +/_ standard error. Significant results are shown by p value examining differences between the MS group and controls or neurological controls; differences between the two control groups were not included for reasons of clarity.
Figure 3
Figure 3
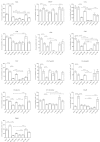
Quantitative immunolabelling of cells from different tissue areas. Quantitative cellular immunolabelling in different tissue areas from sections of brain and spinal cord tissue from multiple sclerosis (MS; 42 sections from 17 cases with 175 areas examined within the plaque (P), 175 within the peri-plaque (PP), 145 within the white matter (WM) and 195 within the grey matter (GM)), non-neurological controls (C; 14 sections from 7 cases with 70 areas examined from both WM and GM) and neurological controls (NC; 11 sections from 9 cases with 55 areas examined from both WM and GM). Groups show mean values +/_ standard error. Significant results are shown by p value examining differences between the MS group and controls or neurological controls for both WM and GM; differences between the control groups were not included for reasons of clarity. Within the MS group, differences were analysed between P and PP/PP and WM.
Figure 4
Figure 4
Cell associated C1q complement staining. Paraffin wax sections A1, A2 and A3 (case MS160_S3, active case). A1 shows immunolabelling with anti-C1q in plaque (P) and peri-plaque (PP) areas. A2 shows C1q immunopositive debris (brown) within foamy macrophages localized in the centre of an active plaque. A3 shows C1q immunolabelled on myelin. B1 paraffin wax section double immunolabelled with anti-C1q (grey) and anti-HLA-DR (brown) confirms C1q immunopositive debris located within HLA positive foamy macrophages cells; (case MS160_S3, active plaque). B2 and B3 also show paraffin wax sections with immune double staining of anti-C1q and anti-HLA-DR (case MS230_s2, chronic active plaque). B2 shows HLA-DR positive cells (brown) closely associated with C1q positive myelin (grey) within the white matter. B3 shows co-localisation of C1q on HLA-DR positive microglia (arrows) in the peri-plaque. C1 (case MS372_22, chronic active plaque) and C2 (case MS230_S2, chronic active plaque, stained using immunofluorescence (IFC)) show double labelling for C1q and GFAP, with colocalisation of C1q (grey) and GFAP (brown) in some but not all cells (insert in C1 and arrow in C2 highlighting colocalisation). IFC in figure D1 (case MS377_S2, active plaque) and D2 (case MS160_S1, active plaque) demonstrate anti-HLA-DR positive macrophages closely associated with C1q positive myelin (arrow). Inset in D2 shows C1q immunopositive debris within an HLA-DR immunolabelled macrophage (arrow). E1 shows a myelin sheath at edge of an active plaque staining with anti-MOG (grey) and C1q (brown) (case MS160_S3, arrow); in the same area E2 (IFC, case MS160_S3) shows a myelin sheath with positive anti-C1q immunolabelling. Figures F1 (MS160_S3/1; chronic active plaque) and F2 (MS336_1; active plaque), captured with confocal laser scanning microscopy, show disrupted myelin, immuno-positive for C1q associated with anti-SMI-32 immunopositive non-phosphorylated axon profiles in chronic and active areas. Scale bars are shown for each plate.
Figure 5
Figure 5
Cell associated C3b complement staining. Paraffin wax section of active peri-plaque regions (A, case MS377_S2; B, case MS383_21) immunolabelled with anti-C3b showing cells with astrocytic morphology. Myelin degradation debris (arrows) within macrophages colabelled with anti-C3b (brown) and MOG (grey) are shown within the centre of an active plaque (C, MS160_S3). Immunofluorescent staining: D1 (case MS 225_S13, chronic active plaque) and D2 (case 377_S2, active plaque) showing colabelling of C3b (red) and GFAP + astrocytes (green) in the peri-plaque white matter. E1 (case MS225_S13, chronic active plaque; plaque (P) and peri-plaque (PP)), E2 and E3 (both case MS377_S2, active plaque) show zones of HLA-DR macrophages/microglia and an adjacent area of predominantly astrocytic and axonal C3b immunolabelled structures. In figure E3, note the close approximation of C3b positive axon (arrow) and HLA positive microglial cell. F shows an anti-C3b positive myelin strand (brown, arrow) co-localised with MOG (grey) on an axon bundle within striatum (case MS160_S3, active plaque). Immunofluorescent staining (G), showing anti-C3b immunopositive myelin (red) co-localised with an anti-SMI-32 (green), immunopositive non-phosphorylated axon at the edge of a chronic active white matter lesion (case MS160_S3, active plaque). Scale bars are shown for each slide.

Similar articles

Cited by

References

    1. Lassmann H, Bruck W, Lucchinetti CF. The immunopathology of multiple sclerosis: an overview. Brain Pathol. 2007;17:210–218. doi: 10.1111/j.1750-3639.2007.00064.x. - DOI - PMC - PubMed
    1. Weiner HL. A shift from adaptive to innate immunity: a potential mechanism of disease progression in multiple sclerosis. J Neurol. 2008;255(Suppl 1):3–11. doi: 10.1007/s00415-008-1002-8. - DOI - PubMed
    1. Ingram G, Hakobyan S, Robertson NP, Morgan BP. Complement in multiple sclerosis: its role in disease and potential as a biomarker. Clin Exp Immunol. 2009;155:128–139. doi: 10.1111/j.1365-2249.2008.03830.x. - DOI - PMC - PubMed
    1. Compston DA, Morgan BP, Oleesky D, Fifield R, Campbell AK. Cerebrospinal fluid C9 in demyelinating disease. Neurology. 1986;36:1503–1506. doi: 10.1212/WNL.36.11.1503. - DOI - PubMed
    1. Compston DA, Morgan BP, Campbell AK, Wilkins P, Cole G, Thomas ND, Jasani B. Immunocytochemical localization of the terminal complement complex in multiple sclerosis. Neuropathol Appl Neurobiol. 1989;15:307–316. doi: 10.1111/j.1365-2990.1989.tb01231.x. - DOI - PubMed

Publication types

Substances