. 2014 May 30;6(6):1724-41.
doi: 10.3390/toxins6061724.

Toxic shock syndrome toxin-1-mediated toxicity inhibited by neutralizing antibodies late in the course of continual in vivo and in vitro exposure

Affiliations

Toxic shock syndrome toxin-1-mediated toxicity inhibited by neutralizing antibodies late in the course of continual in vivo and in vitro exposure

Norbert Stich et al. Toxins (Basel). .

Abstract

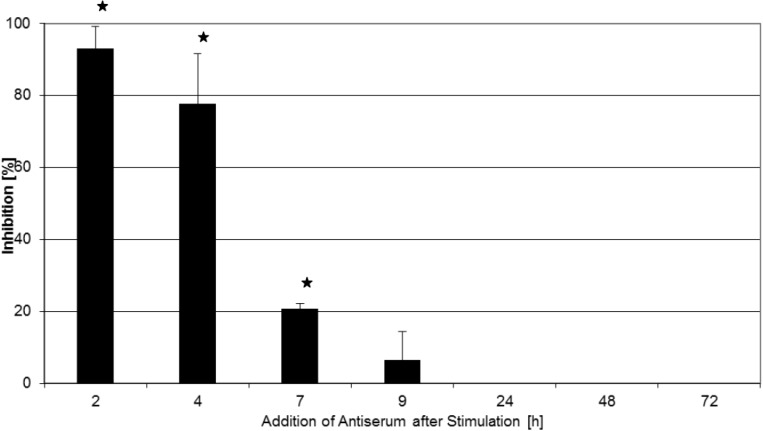
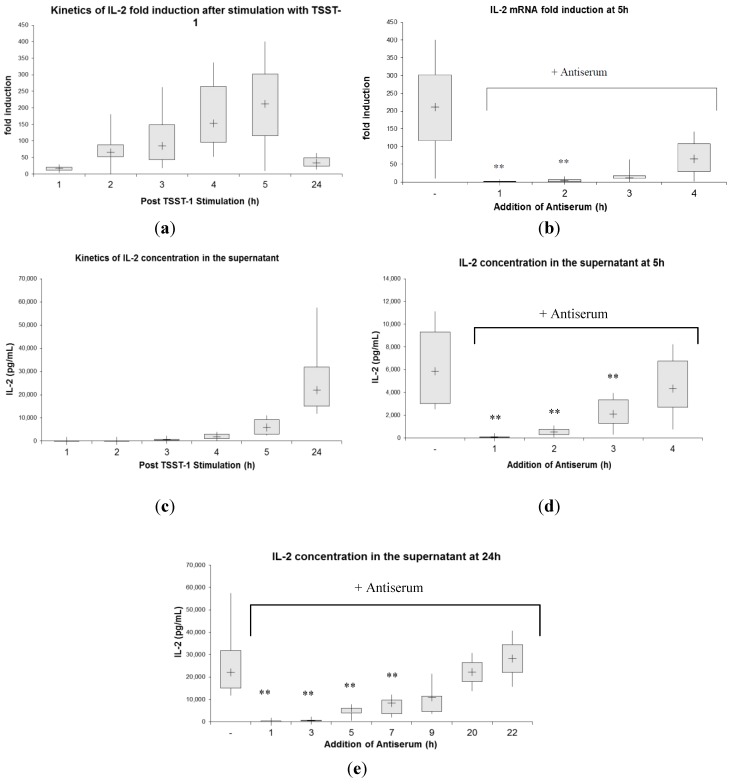
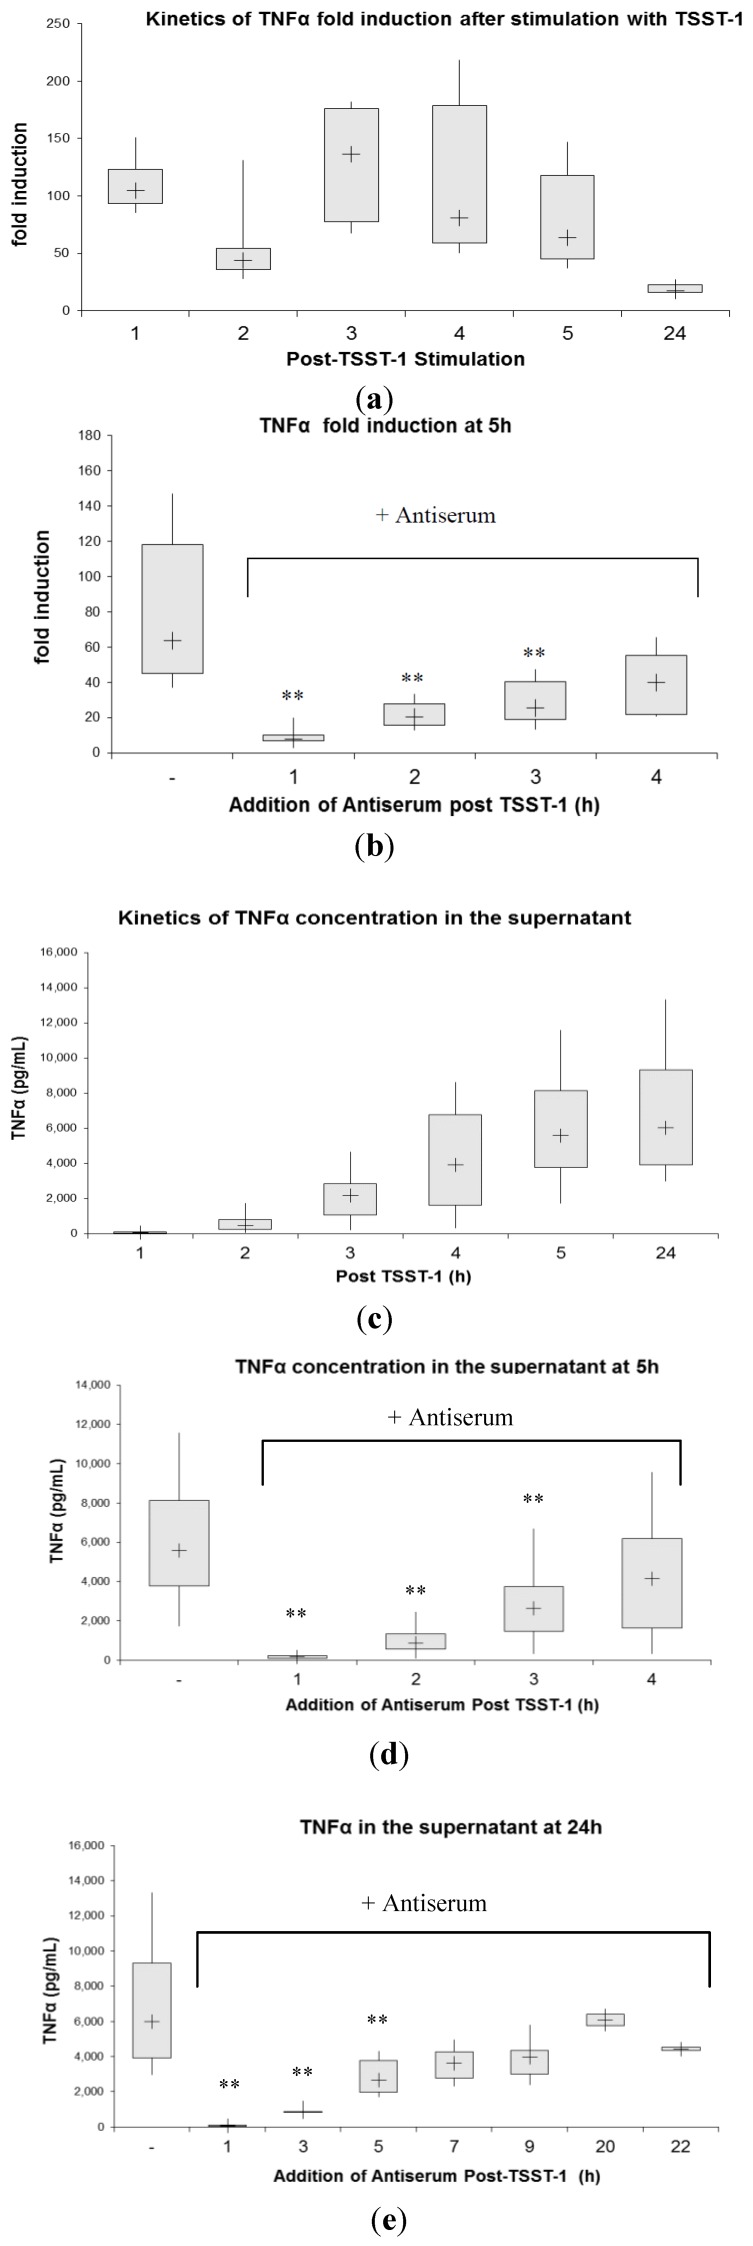
Toxic shock syndrome (TSS) results from the host's overwhelming inflammatory response and cytokine storm mainly due to superantigens (SAgs). There is no effective specific therapy. Application of immunoglobulins has been shown to improve the outcome of the disease and to neutralize SAgs both in vivo and in vitro. However, in most experiments that have been performed, antiserum was either pre-incubated with SAg, or both were applied simultaneously. To mirror more closely the clinical situation, we applied a multiple dose (over five days) lethal challenge in a rabbit model. Treatment with toxic shock syndrome toxin 1 (TSST-1) neutralizing antibody was fully protective, even when administered late in the course of the challenge. Kinetic studies on the effect of superantigen toxins are scarce. We performed in vitro kinetic studies by neutralizing the toxin with antibodies at well-defined time points. T-cell activation was determined by assessing T-cell proliferation (3H-thymidine incorporation), determination of IL-2 release in the cell supernatant (ELISA), and IL-2 gene activation (real-time PCR (RT-PCR)). Here we show that T-cell activation occurs continuously. The application of TSST-1 neutralizing antiserum reduced IL-2 and TNFα release into the cell supernatant, even if added at later time points. Interference with the prolonged stimulation of proinflammatory cytokines is likely to be in vivo relevant, as postexposure treatment protected rabbits against the multiple dose lethal SAg challenge. Our results shed new light on the treatment of TSS by specific antibodies even at late stages of exposure.


Figures

Figure 1
Figure 1
Inhibition of rTSST-1-induced T-cell proliferation by antiserum. Human PBMC were stimulated with 0.3 ng/mL rTSST-1 wt and cultured for four days as described in the Experimental Section. Antiserum generated against rTSST-1 was added at 2 h (n = 8), 4 h (n = 8), 7 h (n = 4), 9 h (n = 4), 24 h (n = 4), 2d (n = 4) or 3d (n = 4) after stimulation in a final dilution of 1:100. Each experiment was carried out in triplicate. Inhibition of proliferation is reported in percentage in relation to negative control serum, values represent the mean, and error bars indicate the standard deviation of multiple experiments. PBMC proliferative response following stimulation with rTSST-1 wt in the presence of negative serum was 60,186 ccpm ± 28,002 (mean ± SD, n = 4). The term “negative serum” refers to a serum derived from animals not immunized against TSST-1, i.e., preimmune serum. PBMC proliferative response following stimulation with rTSST-1 wt without antiserum was 43,388 ccpm ± 6510 (mean ± SD, n = 4). Background proliferative response of cells cultured in medium alone was 1020 ccpm ± 462 (mean ± SD, n = 4). % inhibition was calculated as described in the Experimental Section using the following formula: % inhibition = 100 – ((ccpm 3H thymidin incorporation in the presence of antiserum/ccpm 3H thymidin incorporation in control cultures containing negative serum) × 100). An asterisk indicates a statistically significant (p < 0.05) inhibition (paired Student’s t-test).
Figure 2
Figure 2
(a) Kinetics of IL-2 mRNA expression in human PBMC after stimulation with TSST-1 for designated time intervals. At the corresponding time point, cells were harvested for IL-2 mRNA fold induction analysis via RT PCR as indicated in the Experimental Section. The supernatant of these cultures served for determination of IL-2 concentration (see Figure 2c); (b) IL-2 gene activation in human PBMCs at 5 h after TSST-1 stimulation and inhibition at different time points with anti-TSST-1 antiserum. Antiserum was added at 1 h, 2 h, 3 h and 4 h followed by PBMC harvesting at 5 h. IL-2 mRNA expression was analyzed with real-time PCR as described in the Experimental Section. Stimulation with TSST-1 for 5 h without antiserum served as a control. Simultaneous addition of rTSST-1 wt and antiserum to PBMCs resulted in blocking of IL-2 mRNA expression (fold induction of 1; 1–2; median; interquartile range; n = 6). Simultaneous stimulation with rTSST-1 and negative serum led to a fold induction of 151, 109–167; (median, interquartile range) (n = 5); (c) IL-2 concentration in the supernatant of cultured human PBMCs stimulated with 1 ng/mL TSST-1 for indicated periods. At the designated time points, cells were harvested and IL-2 protein concentration was assessed by ELISA; (d) Amount of IL-2 after 5 h of stimulation with rTSST-1 wt and addition of antiserum at 1 h, 2 h, 3 h, and 4 h. When antiserum and TSST-1 were applied simultaneously for 5 h, we detected 367 pg/mL, 292-379 pg/mL; (median, interquartile range) IL-2 in the supernatant (n = 3) at this time point. PBMCs in medium alone for 5 h secreted 6 pg/mL IL-2, 0–43 pg/mL; (median, interquartile range) (n = 6). When negative serum and rTSST-1 were given simultaneously for 5 h, 3655 pg/mL, 2677–3944 (median, interquartile range) of IL-2 was detected in the supernatant (n = 3); (e) IL-2 secretion 24 h after stimulation. Antiserum was added to the culture at 1 h, 3 h, 5 h, 7 h, 9 h, 20 h, and 22 h and IL-2 secretion was determined at 24 h. The data presented are representative of 6 separate experiments. PBMCs in medium alone for 24 h secreted 27 pg/mL, 15–282 (median, interquartile range) IL-2 (n = 6). ** Statistically significant difference compared with stimulated PBMCs without antiserum using the Wilcoxon signed-ranks test (p < 0.001; n = 6). Box plot diagrams indicate the median (+), interquartile range (box) and minimum and maximum values (whiskers).
Figure 3
Figure 3
(a) Kinetics of TNFα mRNA expression in human PBMC after stimulation with TSST-1 for indicated periods. Cells were harvested and TNFα mRNA was analyzed via real-time PCR. The supernatant of these cultures served for analysis of TNFα protein secretion (see Figure 3c); (b) TNFα gene activation at 5 h after TSST-1 stimulation. Antiserum was added to PBMCs at 1 h, 2 h, 3 h, and 4 h and TNFα mRNA expression was analyzed at 5 h. Simultaneous addition of TSST-1 and antiserum to PBMCs resulted in blocking of TNFα mRNA expression (fold induction of 1.5; 1–2.5, median, interquartile range; n = 6). Simultaneous addition of rTSST-1 and negative serum led to TNFα fold induction of 4 5, 38–50 (median, interquartile range) (n = 6); (c) TNFα concentration in the supernatant of cultured human PBMCs stimulated with 1 ng/mL TSST-1 for indicated periods. TNFα concentration in the supernatant at 5 h (d) and 24 h (e) and the effect of antiserum. When antiserum and TSST-1 were applied simultaneously for 5 h, we detected 2 pg/mL, 1–13 (median, interquartile range) of TNFα in the supernatant (n = 3) at this time point. Negative serum applied simultaneously with rTSST-1 did not influence the accumulation of TNFα in the supernatant compared to rTSST-1 alone (4890 pg/mL, 4869–4911; median, interquartile range) (n = 3). PBMCs in medium alone secreted 0.5 pg/mL, 0–4; median, interquartile range TNFα at 5 h (n = 6) and 26 pg/mL, 15–74 (median, interquartile range) TNFα at 24 h (n = 6). ** Statistically significant difference compared with stimulated PBMCs without antiserum using the Wilcoxon signed-ranks test (p < 0,001; n = 6). Box plot diagrams indicate the median (+), interquartile range (box) and minimum and maximum values (whiskers).

References

    1. Hotchkiss R.S., Karl I.E. The pathophysiology and treatment of sepsis. N. Engl. J. Med. 2003;348:138–150. doi: 10.1056/NEJMra021333. - DOI - PubMed
    1. Fisher C.J., Agosti J.M., Opal S.M. Treatment of septic shock with the tumor necrosis factor receptor: Fc fusion protein. N. Engl. J. Med. 1996;334:1697–1702. doi: 10.1056/NEJM199606273342603. - DOI - PubMed
    1. Reinhart K., Karzai W. Anti-tumor necrosis factor therapy in sepsis: Update on clinical trials and lessons learned. Crit. Care Med. 2001;29:S121–S125. doi: 10.1097/00003246-200107001-00037. - DOI - PubMed
    1. Warren H.S., Suffredini A.F., Eichacker P.Q., Munford R.S. Risks and benefits of activated protein C treatment for severe sepsis. N. Engl. J. Med. 2002;347:1027–1030. doi: 10.1056/NEJMsb020574. - DOI - PubMed
    1. Riedemann N.C., Guo R.F., Ward P.A. The enigma of sepsis. J. Clin. Investig. 2003;112:460–467. doi: 10.1172/JCI200319523. - DOI - PMC - PubMed

Publication types

MeSH terms

LinkOut - more resources