Observational Study
. 2014 May 6;18(3):R91.
doi: 10.1186/cc13859.

Early fluid loading in acute respiratory distress syndrome with septic shock deteriorates lung aeration without impairing arterial oxygenation: a lung ultrasound observational study

Observational Study

Early fluid loading in acute respiratory distress syndrome with septic shock deteriorates lung aeration without impairing arterial oxygenation: a lung ultrasound observational study

Fabiola Caltabeloti et al. Crit Care. .

Abstract

Introduction: The study was designed to assess the impact of fluid loading on lung aeration, oxygenation and hemodynamics in patients with septic shock and acute respiratory distress syndrome (ARDS).

Methods: During a 1-year period, a prospective observational study was performed in 32 patients with septic shock and ARDS. Cardiorespiratory parameters were measured using Swan Ganz (n = 29) or PiCCO catheters (n = 3). Lung aeration and regional pulmonary blood flows were measured using bedside transthoracic ultrasound. Measurements were performed before (T0), at the end of volume expansion (T1) and 40 minutes later (T2), consisting of 1-L of saline over 30 minutes during the first 48 h following onset of septic shock and ARDS.

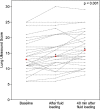
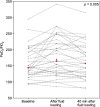
Results: Lung ultrasound score increased by 23% at T2, from 13 at baseline to 16 (P < 0.001). Cardiac index and cardiac filling pressures increased significantly at T1 (P < 0.001) and returned to control values at T2. The increase in lung ultrasound score was statistically correlated with fluid loading-induced increase in cardiac index and was not associated with increase in pulmonary shunt or regional pulmonary blood flow. At T1, PaO2/FiO2 significantly increased (P < 0.005) from 144 (123 to 198) to 165 (128 to 226) and returned to control values at T2, whereas lung ultrasound score continued to increase.

Conclusions: Early fluid loading transitorily improves hemodynamics and oxygenation and worsens lung aeration. Aeration changes can be detected at the bedside by transthoracic lung ultrasound, which may serve as a safeguard against excessive fluid loading.


Figures
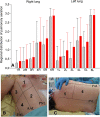
Figure 1
Figure 1
Regional distribution of pulmonary aeration in 32 patients with septic shock and acute respiratory distress syndrome. (A) Right (R, gray bars) and left (L, gray bars) lungs at baseline and 40 minutes after fluid loading (red bars). As shown in (B) and (C), in each patient, six regions of interest were examined on each side, delineated by parasternal line (PSL), anterior axillary line (AAL), posterior axillary line (PAL) and paravertebral line (PVL): 1 = anterior and superior lung region; 2 = anterior and inferior lung region; 3 = lateral and superior lung; 4 = lateral and inferior lung region; 5 = posterior and superior lung region (the acoustic window is located in intercostal spaces between the scapula and vertebrae); 6 = posterior and inferior lung region. Each region of interest is characterized by the worst ultrasound pattern detected allowing the calculation of a regional ultrasound score: Normal = 0, interstitial edema (spaced B1 lines) = 1, interstitial-alveolar edema (coalescent B2 lines) = 2, lung consolidation = 3. The lung ultrasound score (LUS) is calculated as the sum of each individual score, ranging between 0 and 36 [27]. On the Y axis, the mean score per region of interest is indicated ± SD.
Figure 2
Figure 2
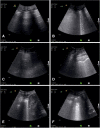
Representative images illustrating lung ultrasound changes following fluid loading in three patients with septic shock and acute respiratory distress syndrome. In the first patient, (A) the image obtained before fluid loading shows normal aeration in the left lateral and superior lung region with the presence of lung sliding and A lines; (B) the image obtained 40 minutes after fluid loading, shows the presence of B1 lines in the same lung region. In the second patient, (C) the image obtained before fluid loading shows normal aeration in the left lateral and inferior lung region with the presence of lung sliding and A lines; (D) the image obtained 40 minutes after fluid loading, shows the presence of B2 lines in the same lung region. In the third patient, (E) the image obtained before fluid loading shows B1 lines in the right lateral and inferior lung region; (F) the image obtained 40 minutes after fluid loading, shows the presence of B2 lines issued from a juxtapleural consolidation in the same lung region.
Figure 3
Figure 3
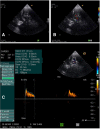
Pulmonary blood flow. (A) Lung consolidation with persisting regional pulmonary blood flow (B) detected using transthoracic Doppler ultrasound in a patient included in the study. Within the consolidation, a pulmonary artery characterized by its biphasic signal is identified (C).
Figure 4
Figure 4
Effects of fluid loading on lung ultrasound score in 32 patients with septic shock and acute respiratory distress syndrome. Individual changes in lung ultrasound score are represented. Red dots represent median values. P <0.001 at the top of the figure indicates a statistically significant difference between the three time points using Friedman repeated measures analysis of variance on the ranks. Comparisons between two time points were performed using the post hoc Tukey test. *P <0.05, baseline versus end of 1,000-mL fluid loading and baseline versus 40 minutes after the end of fluid loading.
Figure 5
Figure 5
Effects of fluid loading on arterial oxygenation in 32 patients with septic shock and acute respiratory distress syndrome. Individual changes in arterial oxygen tension/fraction of inspired oxygen (PaO2/FiO2) are represented. Red dots represent median values. P = 0.005 at the top of the figure indicates a statistically significant difference between the three time points using Friedman repeated measures analysis of variance on the ranks. Comparisons between two time points were performed using the post hoc Tukey test. *P <0.05, baseline versus end of 1,000 mL fluid loading.
Figure 6
Figure 6
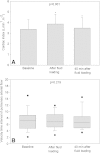
Effects of fluid loading on cardiac index and pulmonary arterial blood flow supplying consolidated lung regions in 32 patients with septic shock and acute respiratory distress syndrome. (A) Changes in cardiac index and (B) velocity time-interval of pulmonary arterial flow supplying consolidated lung regions following a 1,000-mL fluid loading are represented (mean ± SD or median and interquartile range, 25 to 75% according to distribution). P <0.001 at the top of the figure indicates a statistically significant difference between the three time points using analysis of variance for repeated measures. Comparisons between two time points were performed using the post hoc Tukey test. *P <0.05, baseline versus end of a 1,000-mL fluid loading and the end of 1,000-mL fluid loading versus 40 minutes after the end of fluid loading.

References

    1. Monnet X, Osman D, Ridel C, Lamia B, Richard C, Teboul JL. Predicting volume responsiveness by using the end-expiratory occlusion in mechanically ventilated intensive care unit patients. Crit Care Med. 2009;37:951–956. doi: 10.1097/CCM.0b013e3181968fe1. - DOI - PubMed
    1. Pierrakos C, Velissaris D, Scolletta S, Heenen S, De Backer D, Vincent JL. Can changes in arterial pressure be used to detect changes in cardiac index during fluid challenge in patients with septic shock? Int Care Med. 2012;38:422–428. doi: 10.1007/s00134-011-2457-0. - DOI - PubMed
    1. Marshall BE, Hanson CW, Frasch F, Marshall C. Role of hypoxic pulmonary vasoconstriction in pulmonary gas exchange and blood flow distribution. 2. Pathophysiology. Int Care Med. 1994;20:379–389. doi: 10.1007/BF01720916. - DOI - PubMed
    1. Marshall BE, Marshall C, Frasch F, Hanson CW. Role of hypoxic pulmonary vasoconstriction in pulmonary gas exchange and blood flow distribution. 1. Physiologic concepts. Int Care Med. 1994;20:291–297. doi: 10.1007/BF01708968. - DOI - PubMed
    1. Baldi G, Gargani L, Abralo A, D'Errico L, Caramella D, Picano E, Giunta F, Forfori F. Lung water assessment by lung ultrasonography in intensive care: A pilot study. Int Care Med. 2013;39:74–84. doi: 10.1007/s00134-012-2694-x. - DOI - PubMed

Publication types

MeSH terms

LinkOut - more resources