Bacterial diversity assessment in Antarctic terrestrial and aquatic microbial mats: a comparison between bidirectional pyrosequencing and cultivation
- PMID: 24887330
- PMCID: PMC4041716
- DOI: 10.1371/journal.pone.0097564
Bacterial diversity assessment in Antarctic terrestrial and aquatic microbial mats: a comparison between bidirectional pyrosequencing and cultivation
Abstract
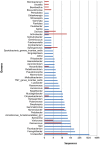
The application of high-throughput sequencing of the 16S rRNA gene has increased the size of microbial diversity datasets by several orders of magnitude, providing improved access to the rare biosphere compared with cultivation-based approaches and more established cultivation-independent techniques. By contrast, cultivation-based approaches allow the retrieval of both common and uncommon bacteria that can grow in the conditions used and provide access to strains for biotechnological applications. We performed bidirectional pyrosequencing of the bacterial 16S rRNA gene diversity in two terrestrial and seven aquatic Antarctic microbial mat samples previously studied by heterotrophic cultivation. While, not unexpectedly, 77.5% of genera recovered by pyrosequencing were not among the isolates, 25.6% of the genera picked up by cultivation were not detected by pyrosequencing. To allow comparison between both techniques, we focused on the five phyla (Proteobacteria, Actinobacteria, Bacteroidetes, Firmicutes and Deinococcus-Thermus) recovered by heterotrophic cultivation. Four of these phyla were among the most abundantly recovered by pyrosequencing. Strikingly, there was relatively little overlap between cultivation and the forward and reverse pyrosequencing-based datasets at the genus (17.1-22.2%) and OTU (3.5-3.6%) level (defined on a 97% similarity cut-off level). Comparison of the V1-V2 and V3-V2 datasets of the 16S rRNA gene revealed remarkable differences in number of OTUs and genera recovered. The forward dataset missed 33% of the genera from the reverse dataset despite comprising 50% more OTUs, while the reverse dataset did not contain 40% of the genera of the forward dataset. Similar observations were evident when comparing the forward and reverse cultivation datasets. Our results indicate that the region under consideration can have a large impact on perceived diversity, and should be considered when comparing different datasets. Finally, a high number of OTUs could not be classified using the RDP reference database, suggesting the presence of a large amount of novel diversity.
Conflict of interest statement
Figures


References
-
- Cowan DA, Tow LA (2004) Endangered Antarctic environments. Annual Review of Microbiology 58: 649–690. - PubMed
-
- Cavicchioli R, Siddiqui KS, Andrews D, Sowers KR (2002) Low-temperature extremophiles and their applications. Current Opinion in Biotechnology 13: 253–261. - PubMed
-
- Loperena L, Soria V, Varela H, Lupo S, Bergalli A, et al. (2012) Extracellular enzymes produced by microorganisms isolated from maritime Antarctica. World Journal of Microbiology & Biotechnology 28. - PubMed
-
- Peeters K, Verleyen E, Hodgson DA, Convey P, Ertz D, et al. (2012) Heterotrophic bacterial diversity in aquatic microbial mat communities from Antarctica. Polar Biology 35.
-
- Van Trappen S, Mergaert J, Van Eygen S, Dawyndt P, Cnockaert MC, et al. (2002) Diversity of 746 heterotrophic bacteria isolated from microbial mats from ten Antarctic lakes. Systematic and Applied Microbiology 25: 603–610. - PubMed
Publication types
MeSH terms
Substances
LinkOut - more resources
Full Text Sources
Other Literature Sources
Research Materials

