. 2014 Jun 2;9(6):e98741.
doi: 10.1371/journal.pone.0098741. eCollection 2014.

Changes in abundance of oral microbiota associated with oral cancer

Affiliations

Changes in abundance of oral microbiota associated with oral cancer

Brian L Schmidt et al. PLoS One. .

Erratum in

  • PLoS One. 2014;9(8):e106297. Muy-Teck The [removed]

Abstract

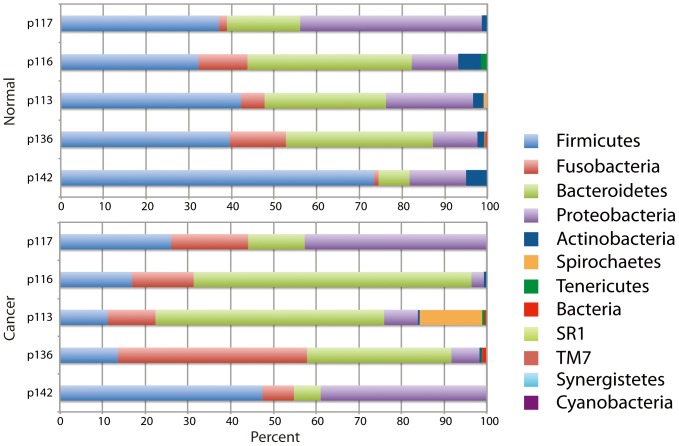
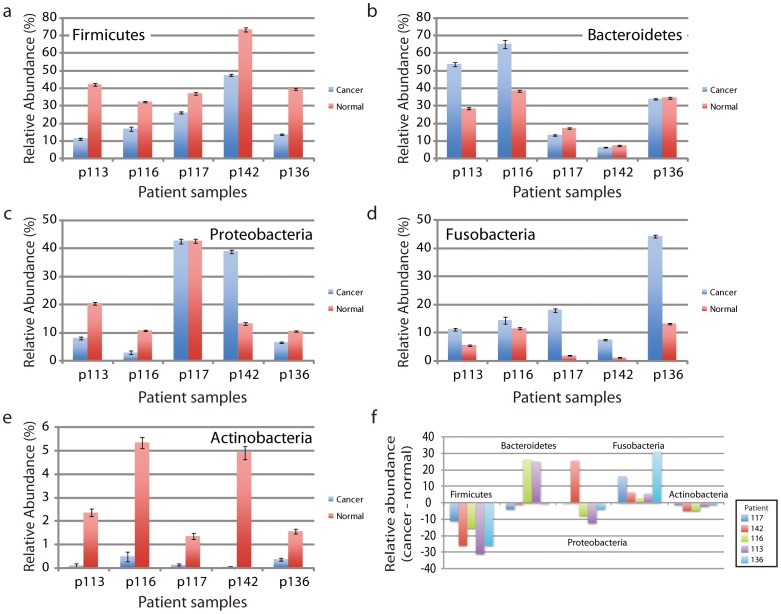
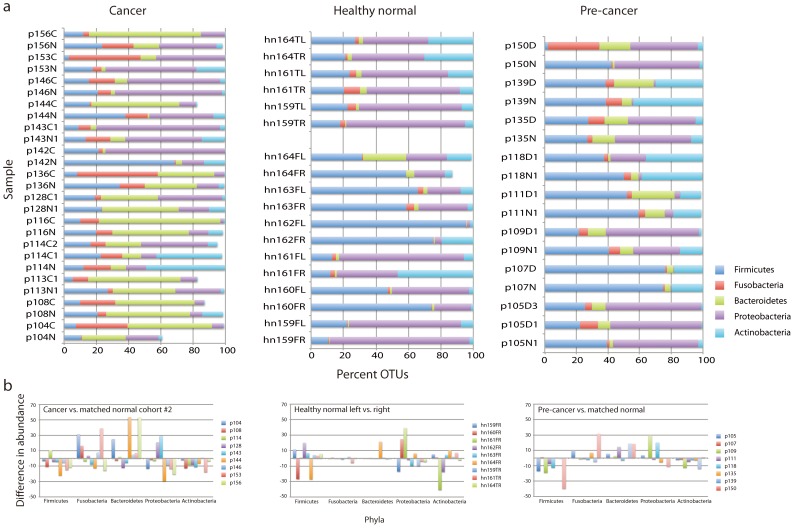
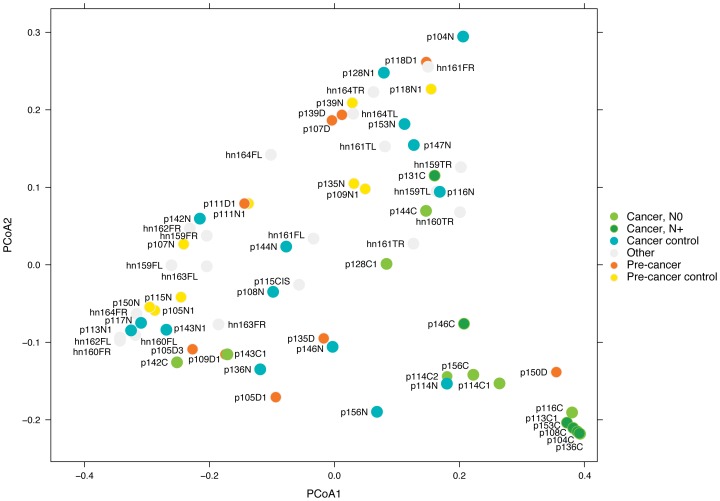
Individual bacteria and shifts in the composition of the microbiome have been associated with human diseases including cancer. To investigate changes in the microbiome associated with oral cancers, we profiled cancers and anatomically matched contralateral normal tissue from the same patient by sequencing 16S rDNA hypervariable region amplicons. In cancer samples from both a discovery and a subsequent confirmation cohort, abundance of Firmicutes (especially Streptococcus) and Actinobacteria (especially Rothia) was significantly decreased relative to contralateral normal samples from the same patient. Significant decreases in abundance of these phyla were observed for pre-cancers, but not when comparing samples from contralateral sites (tongue and floor of mouth) from healthy individuals. Weighted UniFrac principal coordinates analysis based on 12 taxa separated most cancers from other samples with greatest separation of node positive cases. These studies begin to develop a framework for exploiting the oral microbiome for monitoring oral cancer development, progression and recurrence.


Conflict of interest statement

Competing Interests: The receipt of an award for sequencing from Roche, a commercial funder, does not alter the authors' adherence to all the PLOS ONE policies on sharing data and materials. Dr. Justin Kuczynski is an employee of Second Genome, Inc. His employment does not alter the authors' adherence to all the PLOS ONE policies on sharing data and materials.

Figures

Figure 1
Figure 1. Distribution of phyla in normal and cancer samples in Study 1.
The relative distribution of phyla (percent of sequences) is shown for each patient sample with clinically normal samples shown together on top and cancer samples on the bottom.
Figure 2
Figure 2. Change in relative abundance of phyla associated with cancer compared to anatomically matched contralateral clinically normal samples in Study 1.
(a – e) Relative abundance of each of the five more abundant phyla in cancers compared to clinically normal samples from each of five patients. Note, that data are shown on different scales, reflecting the abundance of the phyla. The magnitudes of the changes in abundance are clearly greater than the statistical counting noise, as indicated by the error bar estimates, which are based on the square root of the actual number of reads. (f) Change in relative abundance shown as the difference in abundance of phyla associated with cancers compared to anatomically matched contralateral clinically normal samples. In cancers, decreases in the relative abundance of Firmicutes and Actinobacteria were seen in all patients, while the relative abundance of Fusobacteria was elevated in cancers from all patients.
Figure 3
Figure 3. Distribution of phyla in cancer, pre-cancer and healthy normal samples in Study 2.
(a) Shown is the relative distribution of phyla (percent of sequences). For cancers, we included only patients for which both the cancer and contralateral clinically normal samples were available. (b) Change in relative abundance of phyla shown as the difference in abundance of phyla associated with cancers or pre-cancers compared to anatomically matched contralateral clinically normal samples. For healthy normal samples, we compared left and right sides of the lateral tongue or floor of mouth.
Figure 4
Figure 4. Distinguishing cancer and normal samples.
PCoA based on Weighted UniFrac distance between samples given abundance of 12 OTUs. Axis 1 (PCoA1): 54% of variation explained. Axis 2 (PCoA2): 24% of variation explained. N0 and N+ indicate the nodal status of the cancer patient, N0  =  node negative, N+  =  node positive. Cancer control and pre-cancer control are contralateral clinically normal patient samples. Other identifies samples from healthy normal individuals.

References

    1. Parkin DM, Pisani P, Ferlay J (1999) Global cancer statistics. CA Cancer J Clin 49: 33–64, 31. - PubMed
    1. Shiboski CH, Schmidt BL, Jordan RC (2005) Tongue and tonsil carcinoma: increasing trends in the U.S. population ages 20–44 years. Cancer 103: 1843–1849. - PubMed
    1. Schmidt BL, Dierks EJ, Homer L, Potter B (2004) Tobacco smoking history and presentation of oral squamous cell carcinoma. J Oral Maxillofac Surg 62: 1055–1058. - PubMed
    1. Gillison ML (2004) Human papillomavirus-associated head and neck cancer is a distinct epidemiologic, clinical, and molecular entity. Semin Oncol 31: 744–754. - PubMed
    1. Correa P, Haenszel W, Cuello C, Tannenbaum S, Archer M (1975) A model for gastric cancer epidemiology. Lancet 2: 58–60. - PubMed

Publication types