. 2015 Mar;20(3):369-76.
doi: 10.1038/mp.2014.48. Epub 2014 Jun 3.

Elevated fetal steroidogenic activity in autism

Affiliations

Elevated fetal steroidogenic activity in autism

S Baron-Cohen et al. Mol Psychiatry. 2015 Mar.

Abstract

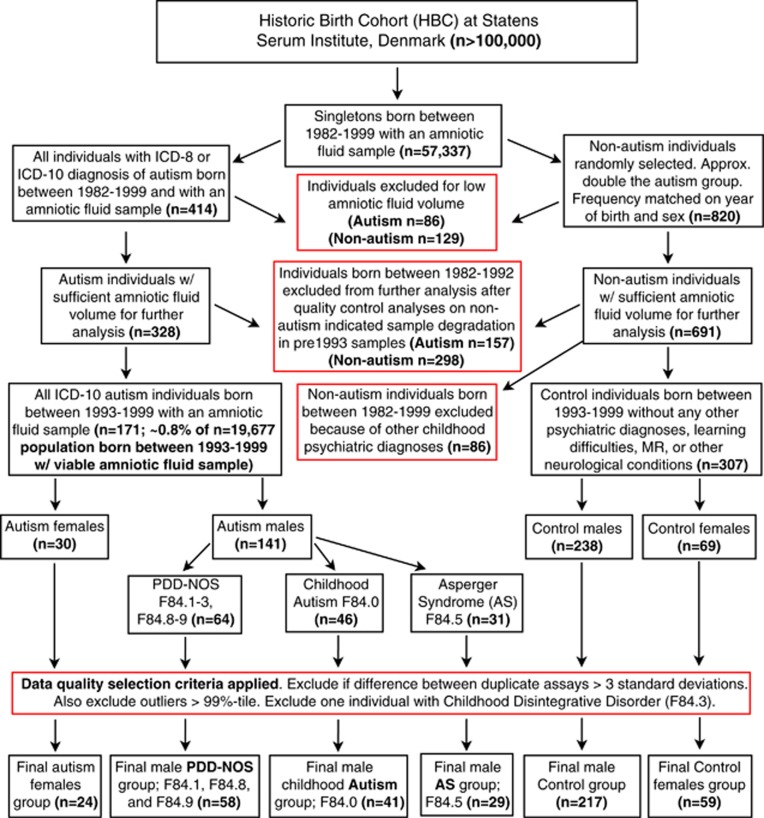
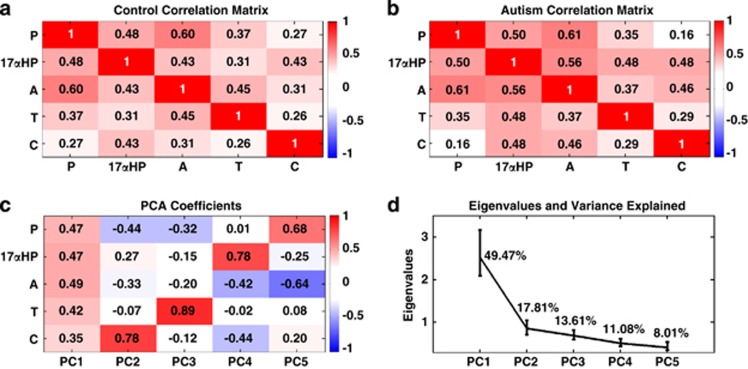
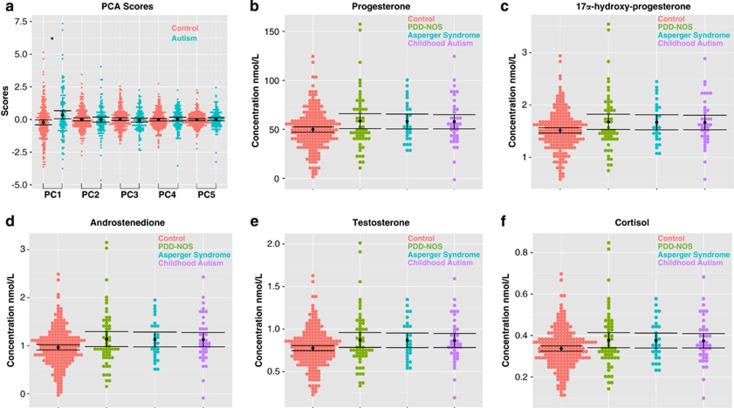
Autism affects males more than females, giving rise to the idea that the influence of steroid hormones on early fetal brain development may be one important early biological risk factor. Utilizing the Danish Historic Birth Cohort and Danish Psychiatric Central Register, we identified all amniotic fluid samples of males born between 1993 and 1999 who later received ICD-10 (International Classification of Diseases, 10th Revision) diagnoses of autism, Asperger syndrome or PDD-NOS (pervasive developmental disorder not otherwise specified) (n=128) compared with matched typically developing controls. Concentration levels of Δ4 sex steroids (progesterone, 17α-hydroxy-progesterone, androstenedione and testosterone) and cortisol were measured with liquid chromatography tandem mass spectrometry. All hormones were positively associated with each other and principal component analysis confirmed that one generalized latent steroidogenic factor was driving much of the variation in the data. The autism group showed elevations across all hormones on this latent generalized steroidogenic factor (Cohen's d=0.37, P=0.0009) and this elevation was uniform across ICD-10 diagnostic label. These results provide the first direct evidence of elevated fetal steroidogenic activity in autism. Such elevations may be important as epigenetic fetal programming mechanisms and may interact with other important pathophysiological factors in autism.


Figures

Figure 1
Figure 1
Flowchart depicting population, selection criteria and stratification into samples used for final analyses. This flowchart shows the original population sizes within the Historic Birth Cohort (HBC) and the population from which our study was drawn from (individuals born between 1993 and 1999). Red boxes indicate steps where data were selected or excluded. AS, Asperger syndrome; PDD-NOS, pervasive developmental disorder not otherwise specified; MR, mental retardation.
Figure 2
Figure 2
Associations between steroid hormones and latent steroidogenic factors. (a and b) Correlation matrices depicting the relationships between all hormones measured in the study for the typically developing the control group (a) and the autism group (b). (c) PCA loading coefficients for each hormone on each component. (d) A scree plot of the eigenvalues for each component and the percentage of variation each component explains. Error bars in (d) represent the 95% bias-corrected and accelerated bootstrap confidence intervals for the eigenvalues estimated from 10 000 bootstrap resamples.  A, androstenedione; C, cortisol; 17αHP, 17α-hydroxy-progesterone;  P, progesterone; PCA, principal component analysis; T, testosterone.
Figure 3
Figure 3
Group differences in amniotic fluid hormone concentration levels across each group. PCA scores for each component are shown in  (a). The mean is shown as a black dot, and the error bars represent the 95% confidence intervals. Underneath the mean and error bars are dots for each individual in the sample (controls, pink; autism, light blue). *A group difference (passing the Bonferroni-corrected α of P<0.01) in the first principal component (PC) (Cohen's d=0.37, P=0.0009), where scores are elevated in autism compared with controls. (bf) The hormone concentrations after the data are reconstructed from the first PC scores and loadings. These bar graphs enable viewing of the patterns across each hormone and across each ICD-10 autism subgroup, to describe what contributes to the group differences in the latent steroidogenic factor represented by the first PC. In these plots, the mean is shown as a black dot and the error bars represent the 95% confidence intervals. Underneath the mean and error bars are dots for each individual in the sample (controls, pink; PDD-NOS, green; Asperger syndrome (AS), light blue; childhood autism, purple). PCA, principal component analysis;  PDD-NOS, pervasive developmental disorder not otherwise specified.

References

    1. Baird G, Simonoff E, Pickles A, Chandler S, Loucas T, Meldrum D,, et al. Prevalence of disorders of the autism spectrum in a population cohort of children in South Thames: the Special Needs and Autism Project (SNAP) Lancet. 2006;368:210–215. - PubMed
    1. Baron-Cohen S, Lombardo MV, Auyeung B, Ashwin E, Chakrabarti B, Knickmeyer R. Why are autism spectrum conditions more prevalent in males. PLoS Biol. 2011;9:e1001081. - PMC - PubMed
    1. Baron-Cohen S. The extreme male brain theory of autism. Trends Cogn Sci. 2002;6:248–254. - PubMed
    1. Jessen HM, Auger AP. Sex differences in epigenetic mechanisms may underlie risk and resilience for mental health disorders. Epigenetics. 2011;6:857–861. - PMC - PubMed
    1. Morgan CP, Bale TL. Sex differences in microRNA regulation of gene expression: no smoke, just miRs. Biol Sex Differ. 2012;3:22. - PMC - PubMed

Publication types