

Ecological niche and potential distribution of Anopheles arabiensis in Africa in 2050
- PMID: 24888886
- PMCID: PMC4066281
- DOI: 10.1186/1475-2875-13-213
Ecological niche and potential distribution of Anopheles arabiensis in Africa in 2050
Abstract
Background: The future distribution of malaria in Africa is likely to be much more dependent on environmental conditions than the current distribution due to the effectiveness of indoor and therapeutic anti-malarial interventions, such as insecticide-treated nets (ITNs), indoor residual spraying for mosquitoes (IRS), artemisinin-combination therapy (ACT), and intermittent presumptive treatment (IPT). Future malaria epidemiology is therefore expected to be increasingly dominated by Anopheles arabiensis, which is the most abundant exophagic mosquito competent to transmit Plasmodium falciparum and exhibits a wide geographic range.
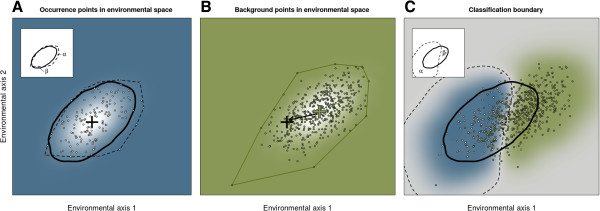
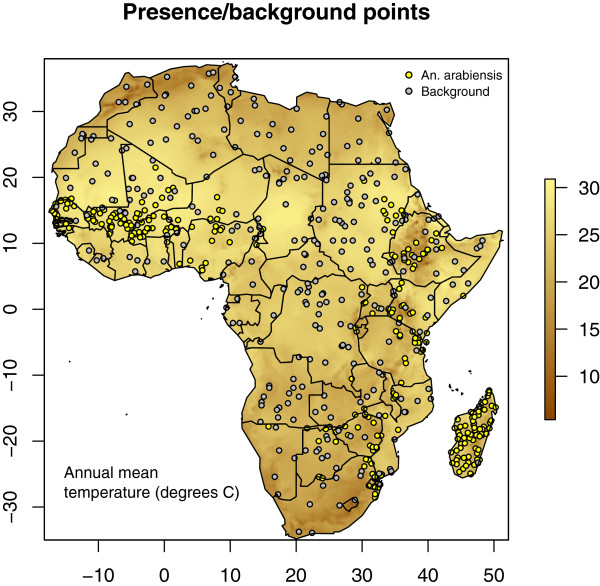
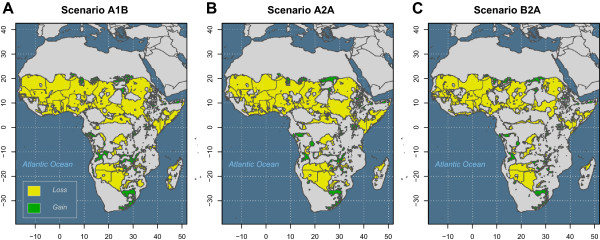
Methods: To map the potential distribution of An. arabiensis in Africa, ecological niche models were fit to 20th century collection records. Many common species distribution modelling techniques aim to discriminate species habitat from the background distribution of environments. Since these methods arguably result in unnecessarily large Type I and Type II errors, LOBAG-OC was used to identify the niche boundary using only data on An. arabiensis occurrences. The future distribution of An. arabiensis in Africa was forecasted by projecting the fit model onto maps of simulated climate change following three climate change scenarios.
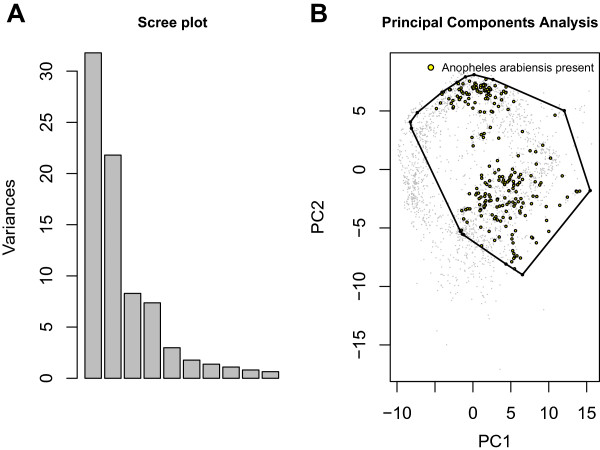
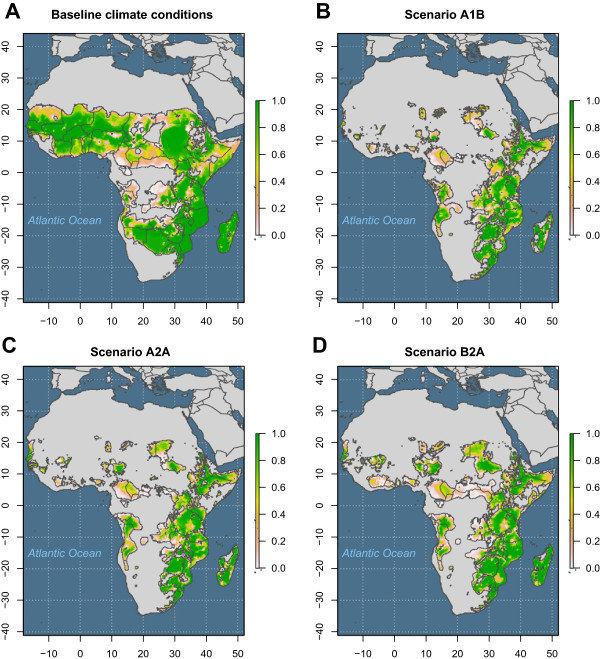
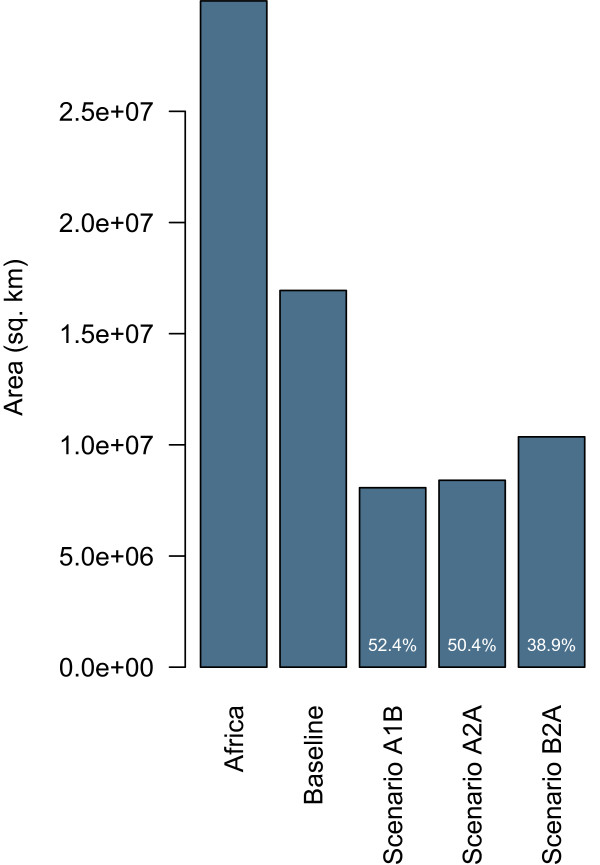
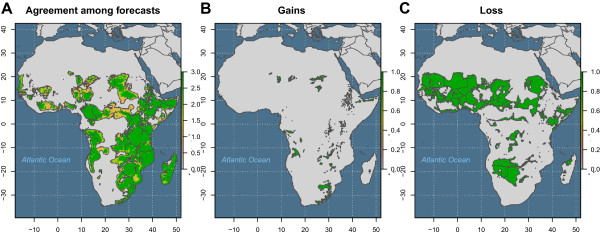
Results: Ecological niche modelling revealed An. arabiensis to be a climate generalist in the sense that it can occur in most of Africa's contemporary environmental range. Under three climate change scenarios, the future distribution of An. arabiensis is expected to be reduced by 48%-61%. Map differences between baseline and projected climate suggest that habitat reductions will be especially extensive in Western and Central Africa; portions of Botswana, Namibia, and Angola in Southern Africa; and portions of Sudan, South Sudan, Somalia, and Kenya in East Africa. The East African Rift Valley and Eastern Coast of Africa are expected to remain habitable. Some modest gains in habitat are predicted at the margins of the current range in South Sudan, South Africa, and Angola.
Conclusion: In summary, these results suggest that the future potential distribution of An. arabiensis in Africa is likely to be smaller than the contemporary distribution by approximately half as a result of climate change. Agreement among the three modelling scenarios suggests that this outcome is robust to a wide range of potential climate futures.
Figures
Similar articles
-
Malaria vectors in South America: current and future scenarios.Parasit Vectors. 2015 Aug 19;8:426. doi: 10.1186/s13071-015-1038-4. Parasit Vectors. 2015. PMID: 26283539 Free PMC article.
-
Habitat suitability and ecological niche profile of major malaria vectors in Cameroon.Malar J. 2009 Dec 23;8:307. doi: 10.1186/1475-2875-8-307. Malar J. 2009. PMID: 20028559 Free PMC article.
-
Predicting and mapping malaria under climate change scenarios: the potential redistribution of malaria vectors in Africa.Malar J. 2010 Apr 23;9:111. doi: 10.1186/1475-2875-9-111. Malar J. 2010. PMID: 20416059 Free PMC article.
-
Malaria Vectors and Vector Surveillance in Limpopo Province (South Africa): 1927 to 2018.Int J Environ Res Public Health. 2020 Jun 9;17(11):4125. doi: 10.3390/ijerph17114125. Int J Environ Res Public Health. 2020. PMID: 32527067 Free PMC article. Review.
-
Bacterial larvicides used for malaria vector control in sub-Saharan Africa: review of their effectiveness and operational feasibility.Parasit Vectors. 2019 Aug 30;12(1):426. doi: 10.1186/s13071-019-3683-5. Parasit Vectors. 2019. PMID: 31470885 Free PMC article. Review.
Cited by
-
Range dynamics of Anopheles mosquitoes in Africa suggest a significant increase in the malaria transmission risk.Ecol Evol. 2024 Jul 31;14(8):e70059. doi: 10.1002/ece3.70059. eCollection 2024 Aug. Ecol Evol. 2024. PMID: 39091337 Free PMC article.
-
Morphological identification and genetic characterization of Anopheles stephensi in Somaliland.Parasit Vectors. 2022 Jul 8;15(1):247. doi: 10.1186/s13071-022-05339-y. Parasit Vectors. 2022. PMID: 35804441 Free PMC article.
-
Trends in mosquito species distribution modeling: insights for vector surveillance and disease control.Parasit Vectors. 2023 Aug 28;16(1):302. doi: 10.1186/s13071-023-05912-z. Parasit Vectors. 2023. PMID: 37641089 Free PMC article.
-
Predicting the global mammalian viral sharing network using phylogeography.Nat Commun. 2020 May 8;11(1):2260. doi: 10.1038/s41467-020-16153-4. Nat Commun. 2020. PMID: 32385239 Free PMC article.
-
Molecular and morphological identification of suspected Plasmodium vivax vectors in Central and Eastern Sudan.Malar J. 2021 Mar 4;20(1):132. doi: 10.1186/s12936-021-03671-9. Malar J. 2021. PMID: 33663534 Free PMC article.
References
Publication types
MeSH terms
Grants and funding
LinkOut - more resources
Full Text Sources
Other Literature Sources
Medical
