. 2014 Nov 1;522(16):3733-53.
doi: 10.1002/cne.23635. Epub 2014 Jul 10.

Retinofugal projections in the mouse

Affiliations

Retinofugal projections in the mouse

Lawrence P Morin et al. J Comp Neurol. .

Abstract

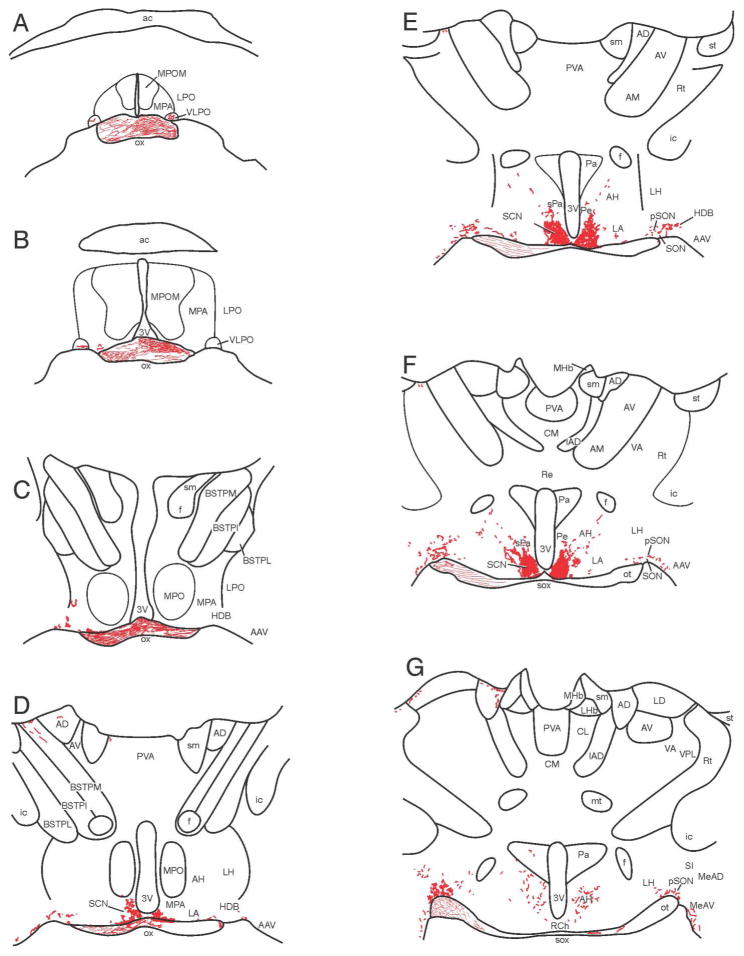
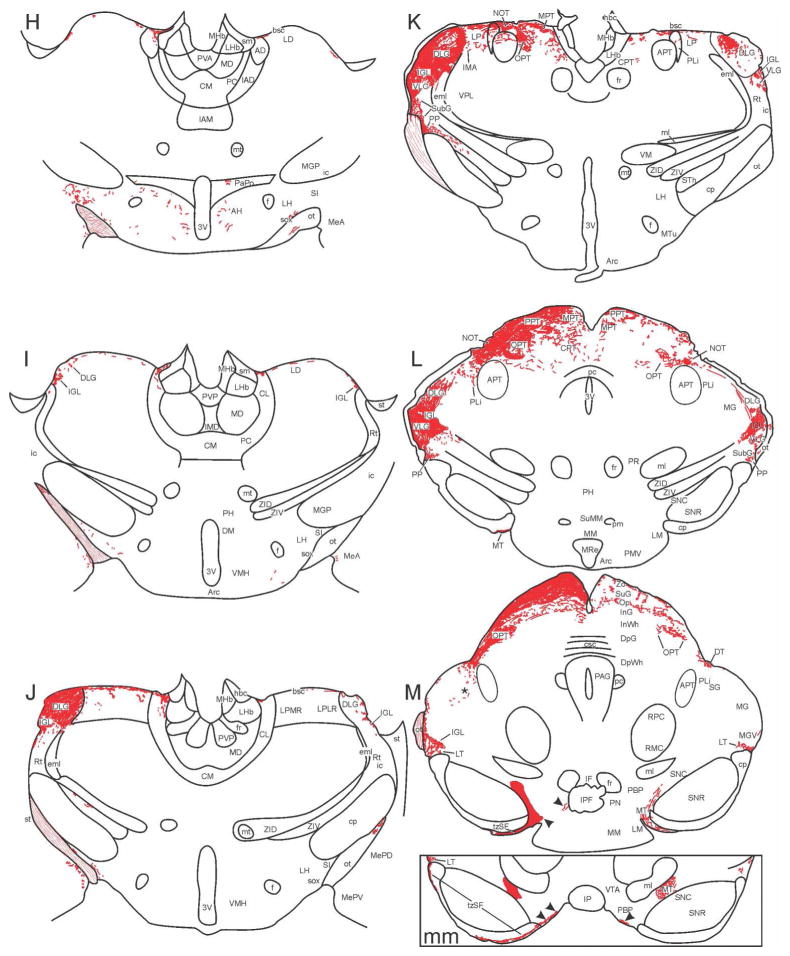
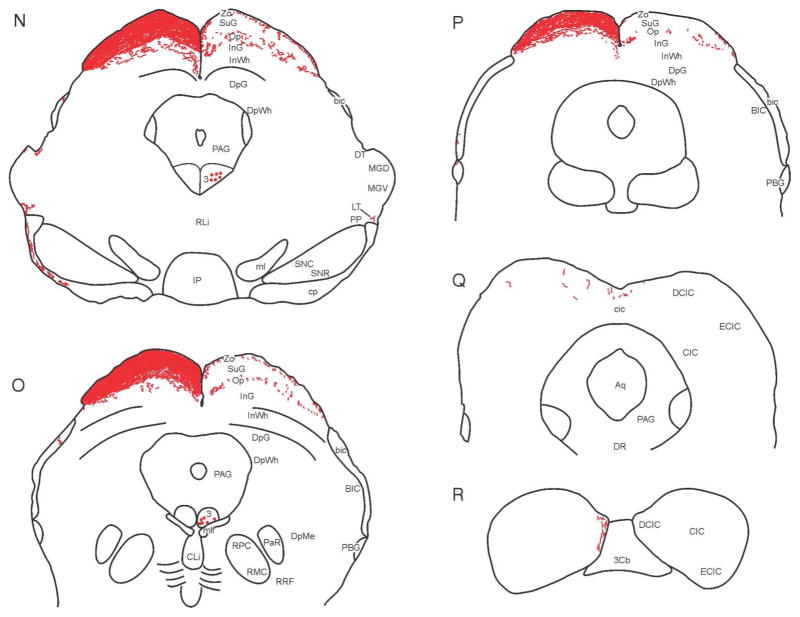
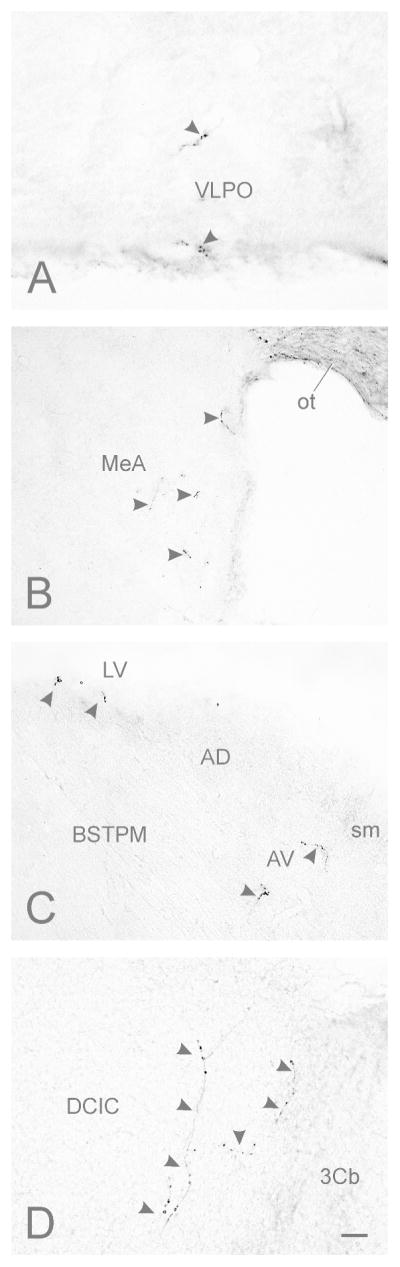
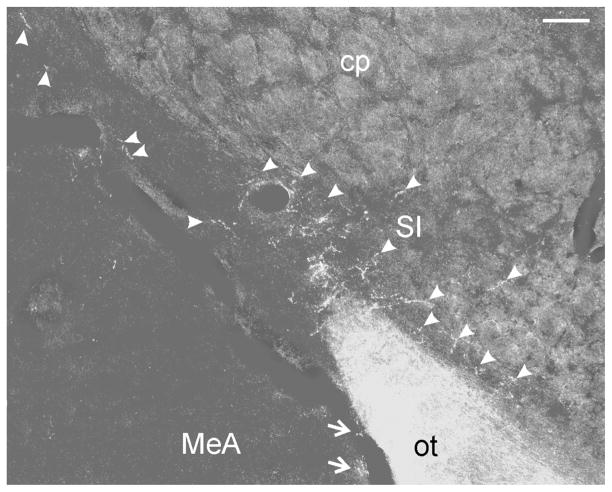
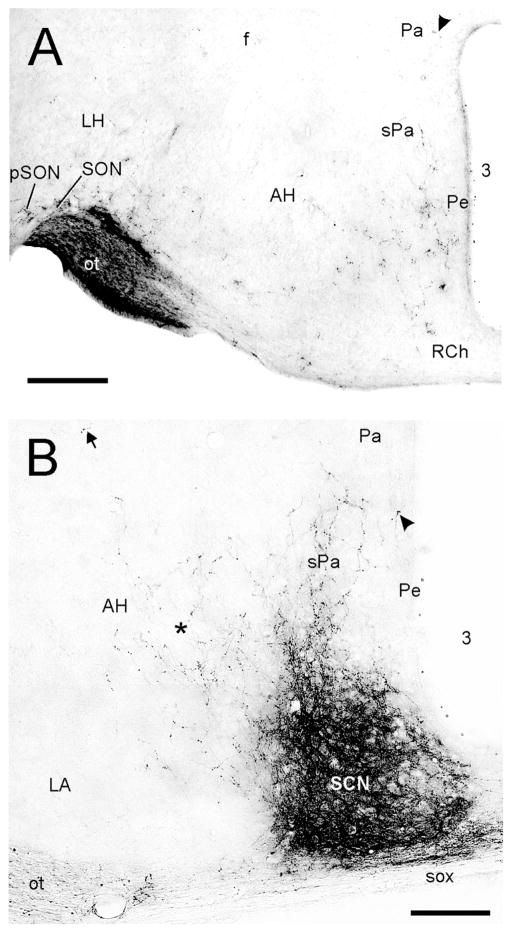
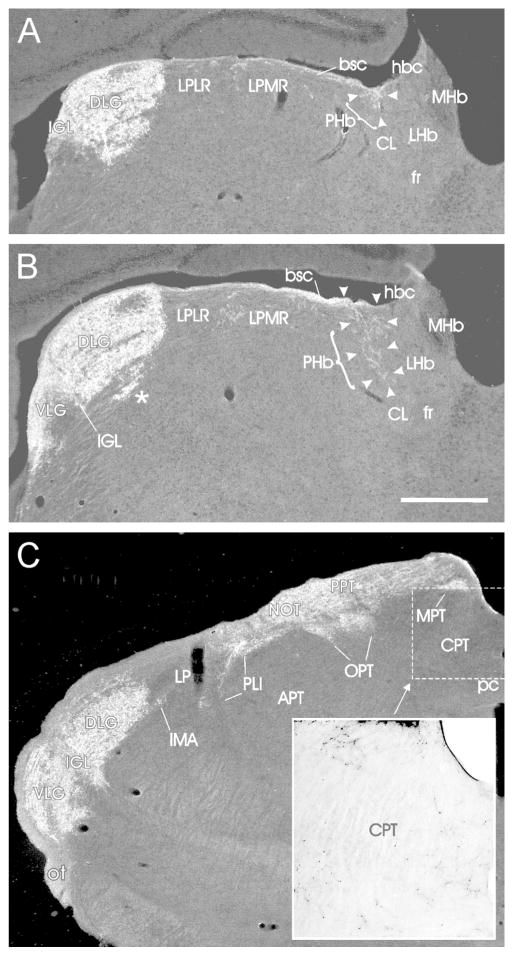
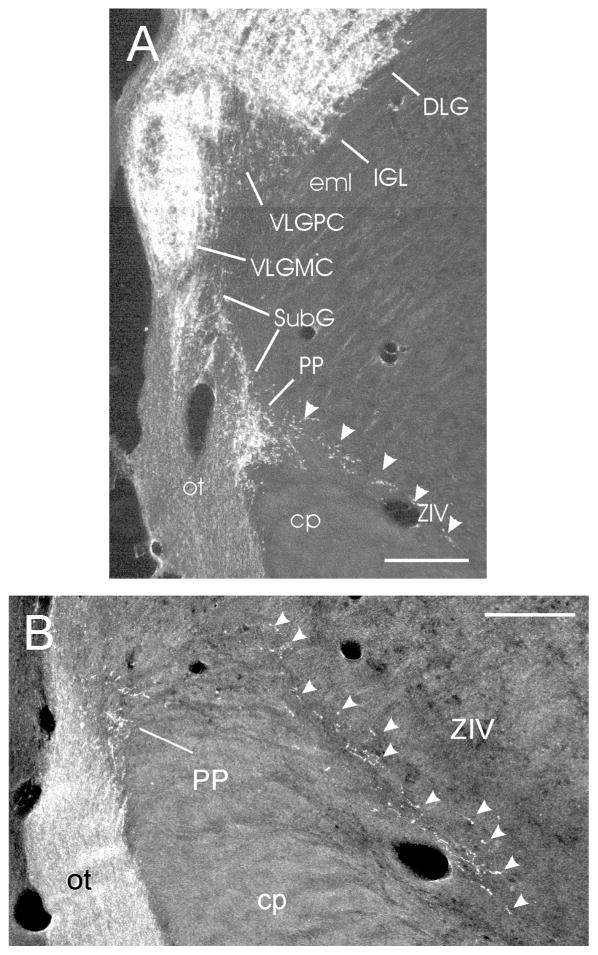
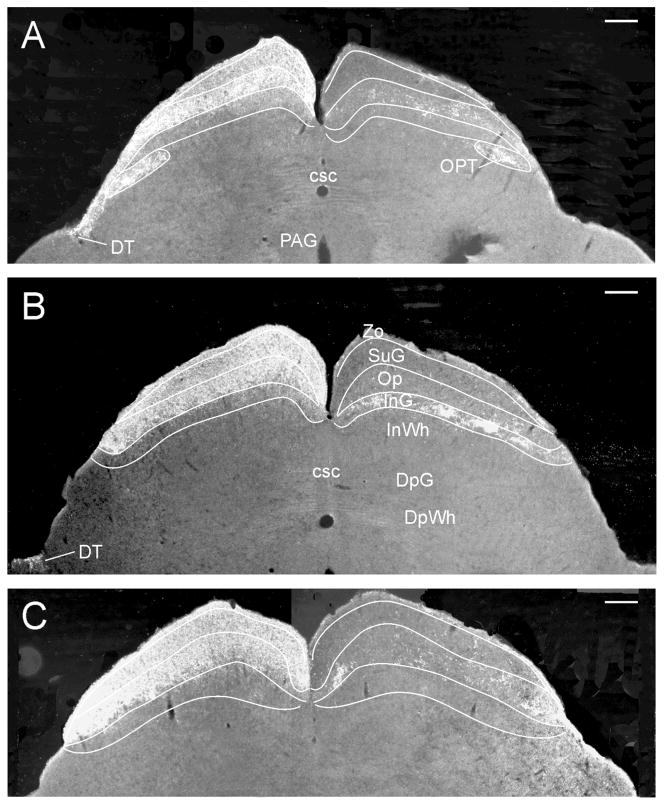
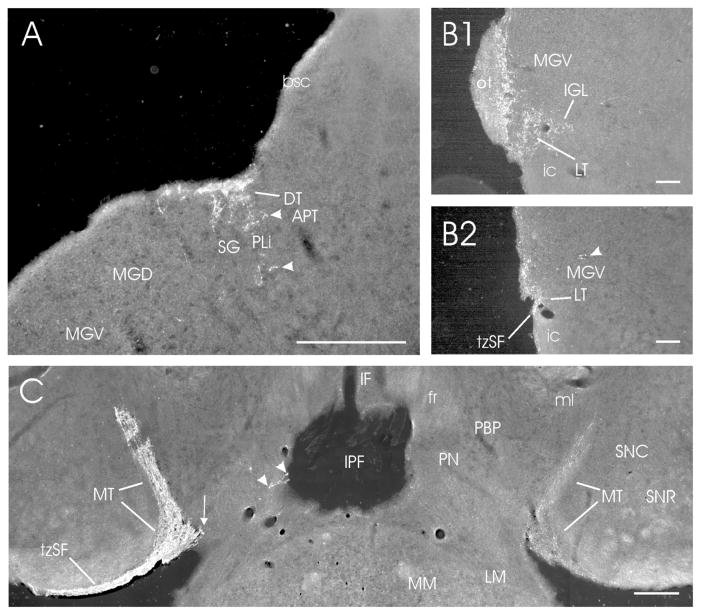
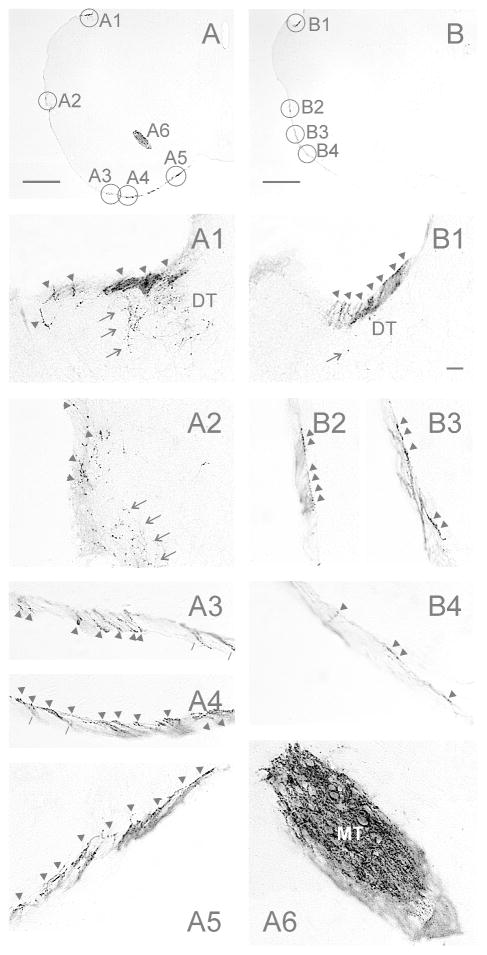
The laboratory mouse is increasingly a subject for visual system investigation, but there has been no comprehensive evaluation of this species' visual projections. Here, projections were visualized and mapped following intraocular injection of cholera toxin B subunit. Tissue was processed using standard procedures applied to 30 μm free-floating sections with diaminobenzidine as the chromogen. The mouse retina projects to ~46 brain regions, including 14 not previously described in this species. These include two amygdaloid nuclei, the horizontal limb of the diagonal band, the paraventricular hypothalamic nucleus, several visual thalamic nuclei, the paranigral nucleus, several pretectal nuclei, and the dorsal cortex of the inferior colliculus. Dense retinal patches were also observed in a narrow portion of the ipsilateral intermediate layer of the superior colliculus. The superior fasciculus of the accessory optic tract, which innervates the medial terminal nucleus, was also determined to be a terminal zone throughout its length. The results are compared with previous descriptions of projections from mouse intrinsically photoreceptive retinal ganglion cells, and with data from the hamster, Nile grass rat, and laboratory rat. The retinal projection patterns are similar in all four species, although there are many differences with respect to the details. The specific visual functions of most retinorecipient areas are unknown, but there is substantial convergence of retinal projections onto regions concerned with olfaction and audition.

Keywords: JAX:000664; auditory; melanopsin; nonimage forming; olfactory; retinorecipient; subcortical; visual system.


Conflict of interest statement

Conflict of Interest Statement

None of the authors has any known or potential conflict of interest including any financial, personal, or other relationships with other people or organizations within 3 years of beginning the study submitted that could inappropriately influence, or be perceived to influence, their work.

Figures

Figure 1
Figure 1
Map of retinal projections in c57bl\6j mouse after a left eye injection of CT-B. Tracings from 30 μm thick brain sections (A–R) were made using a camera lucida. Labeling of structures was guided by reference to the Paxinos and Franklin (2004) mouse brain atlas and the Morin and Wood (2001) hamster brain atlas. Arrowheads in levels M and mm (level mm is approximately 60 μm caudal to level M) point at labeled ipsi- and contralateral projections medial to the MT. Closed circles shown in the oculomotor nucleus (labeled ‘3’) in levels N and O identify retrogradely labeled cell bodies.
Figure 1
Figure 1
Map of retinal projections in c57bl\6j mouse after a left eye injection of CT-B. Tracings from 30 μm thick brain sections (A–R) were made using a camera lucida. Labeling of structures was guided by reference to the Paxinos and Franklin (2004) mouse brain atlas and the Morin and Wood (2001) hamster brain atlas. Arrowheads in levels M and mm (level mm is approximately 60 μm caudal to level M) point at labeled ipsi- and contralateral projections medial to the MT. Closed circles shown in the oculomotor nucleus (labeled ‘3’) in levels N and O identify retrogradely labeled cell bodies.
Figure 2
Figure 2
Photomicrographs of contralateral retinorecipient regions in mouse brain. (A) Ventrolateral preoptic area (VLPO; density = ±); (B) Anterior medial amygdala (MeA; density = +); (C) bed nucleus of the stria terminalis, posteromedial division (BSTPM; density = ±); (D) dorsal cortex of the inferior colliculus (DCIC; density = +). Arrowheads indicate terminals and fibers originating from retinal ganglion cells. No ipsilateral projections were seen in the inferior colliculus. Bar in (H) = 10 μm.
Figure 3
Figure 3
Darkfield photomicrograph showing retinal projections in the substantia innominata (SI; density = ++; arrowheads) at the level of Fig. 1H. Projections are also evident in adjacent anterior medial amygdala (MeA; arrows). Bar = 100 μm.
Figure 4
Figure 4
Brightfield photomicrographs showing contralateral projections to the mid-level mouse suprachiasmatic nucleus (SCN) and adjacent hypothalamus. (A) Projections to the SCN are very dense (density = +++++), with moderately dense projections extending dorsally into the subparaventricular hypothalamus (sPa; density = ++) and medial anterior hypothalamus (AH; density = +; asterisk). Dorsolaterally, very sparse projections are found in close proximity to the fornix (arrow; cf. Fig. 1E–G). Very sparse innervation (density = ±) is present in the periventricular hypothalamus (arrowhead). (B) In a plane of section caudal to the SCN, sparse innervation is visible in the retrochiasmatic area (RCh; density = +), medial AH and sPa, with very sparse innervation (density = ±) present in the Pa (arrowhead). In this image, moderately dense innervation is seen in the peri-supraoptic nucleus (pSON; density = +++) and modestly dense innervation in the lateral hypothalamus (LH; density = ++). Bars = 200 μm.
Figure 5
Figure 5
Darkfield photomicrographs showing retinal innervation in nuclei of the mouse subcortical visual shell. Level (A) is the most rostral and corresponds to Fig. 1J. Level (B) is about 60 μm caudal to Fig. 1J and level (C) is about 120 μm further caudal, between Fig. 1K and L. (A, B) Arrowheads and brackets delineate moderate retinal innervation in portions of the elongated para-habenular zone (PHb; density = +++). Fibers extend into the dorsal part of the centrolateral (CL) thalamic nucleus from the brachium of the superior colliculus (bsc). (B), * identifies a ventromedial sector of the DLG that is spatially distinct from the remainder of the nucleus. (C, Inset) is a brightfield enlargement of the CPT region delineated by the dashed rectangle. Retinal innervation is sparse (density = +), but broadly distributed across the CPT. Bar in (B) = 500 μm and applies to the darkfield images (A–C).
Figure 6
Figure 6
Darkfield photomicrographs showing retinal projections to the mouse VLG and sub-geniculate region (as in Fig. 1K). (A) Modestly dense fibers and terminals are present in the subgeniculate nucleus (SubG; density = ++), ventral to the ventrolateral geniculate region, with dense innervation evident in the central part of the peripeduncular nucleus (PP; density = ++++). Arrowheads identify sparse projections in the dorsolateral part of the ventral zona incerta (ZIV; density = +). (B) Retinal projections in the caudal PP and extending further ventromedially in the ZIV (arrowheads). Bars = 200 μm.
Figure 7
Figure 7
Darkfield photomicrographs showing retinal innervation in several layers of the mouse superior colliculus. (A–C) Images are from consecutively mounted tissue sections corresponding to the levels shown in Fig. 1M, mm and N (about 60 μm apart). “Patches” of terminals are evident in the ipsilateral mouse Op (A–C), but also in one level (B) of the ipsilateral InG. Bars = 200 μm.
Figure 8
Figure 8
Darkfield photomicrographs showing retinal projections to the accessory optic terminal nuclei and adjacent structures in the mouse. (A) Dorsal terminal nucleus (DT; contralateral; density = ++++); (B1,B2) Lateral terminal nucleus (LT; density = ++) at two contralateral levels (B1; rostral) and (B2; caudal); and (D) Medial terminal nuclei (MT; bilateral; density = +++++/+++ contra/ipsi). In (A), the DT is superficially present at the juncture of midbrain and thalamus. Ventral to it are projections (arrowheads) that lie in the caudal PLi or MG/SG (see Discussion). In (B1), the LT is evident immediately below the MGV and the most caudal IGL, at the dorsal boundary of the cerebral peduncle and the most caudal remnant of the optic tract (cf., Fig. 1M). Slightly more caudally (B2), neither the optic tract nor the IGL is present. In (B2), the Arrowhead points at retinal fibers crossing the caudal MGV. In (C), the MT is visible bilaterally. A small medial extension of the contralateral MT is indicated by the arrow, and arrowheads point at very sparse projections in the paranigral nucleus (PN; cf., Fig. 1M,mm; density = ±). Bars for A, C = 200 μm; bars for B1–2 = 100 μm.
Figure 9
Figure 9
Retinal projections with “chains” of terminal-like varicosities in the terminal zone of the superior fasciculus (tzSF) of the mouse accessory optic system. (A,B) Low magnification images showing the superior fasciculus at of two levels of the mouse brain. Image (A) corresponds to Fig. 1mm and image (B) corresponds to Fig. 1M. The circles in (A) and (B) identify the location of the images (A1–A5) and (B1–B4), respectively. (A2) illustrates terminals in the LT of image (A) at the same level as Figs. 1mm and 7B2. (A6) shows the dorsal MT in image (A). In images (A1–5; B1–4), arrowheads point at chains of terminal varicosities. In images (A1, A2, B1), arrows indicate loosely scattered fibers and terminals. The pointers in (A3,A4) are directed at identical locations in the two images, but in one (A3), the external part of the terminal zone is in the focal plane, whereas in the other (A4), the internal part is in focus. (A,B) Bars = 500 μm. (B1) Bar = 20 μm and applies to images (A1–A6; B1–B4).

References

    1. Allen AE, Brown TM, Lucas RJ. A distinct contribution of short-wavelength-sensitive cones to light-evoked activity in the mouse pretectal olivary nucleus. J Neurosci. 2011;31(46):16833–16843. - PMC - PubMed
    1. Berson DM, Dunn FA, Takao M. Phototransduction by retinal ganglion cells that set the circadian clock. Science. 2002;295(5557):1070–1073. - PubMed
    1. Budinger E, Heil P, Scheich H. Functional organization of auditory cortex in the Mongolian gerbil (Meriones unguiculatus). IV. Connections with anatomically characterized subcortical structures. Eur J Neurosci. 2000;12(7):2452–2474. - PubMed
    1. Budinger E, Scheich H. Anatomical connections suitable for the direct processing of neuronal information of different modalities via the rodent primary auditory cortex. Hear Res. 2009;258(1–2):16–27. - PubMed
    1. Chen SK, Badea TC, Hattar S. Photoentrainment and pupillary light reflex are mediated by distinct populations of ipRGCs. Nature. 2011;476(7358):92. - PMC - PubMed

Publication types

LinkOut - more resources