. 2014 Jun 3:5:3981.
doi: 10.1038/ncomms4981.

Monitoring the dynamics of clonal tumour evolution in vivo using secreted luciferases

Affiliations
Free PMC article

Monitoring the dynamics of clonal tumour evolution in vivo using secreted luciferases

Joël P Charles et al. Nat Commun. .
Free PMC article

Abstract

Tumours are heterogeneous cell populations that undergo clonal evolution during tumour progression, metastasis and response to therapy. Short hairpin RNAs (shRNAs) generate stable loss-of-function phenotypes and are versatile experimental tools to explore the contribution of individual genetic alterations to clonal evolution. In these experiments tumour cells carrying shRNAs are commonly tracked with fluorescent reporters. While this works well for cell culture studies and leukaemia mouse models, fluorescent reporters are poorly suited for animals with solid tumours--the most common tumour types in cancer patients. Here we develop a toolkit that uses secreted luciferases to track the fate of two different shRNA-expressing tumour cell clones competitively, both in vitro and in vivo. We demonstrate that secreted luciferase activities can be measured robustly in the blood stream of tumour-bearing mice to accurately quantify, in a minimally invasive manner, the dynamic evolution of two genetically distinct tumour subclones in preclinical mouse models of tumour development, metastasis and therapy.


Figures

Figure 1
Figure 1. Dynamic monitoring of clonal evolution in cell culture with secreted luciferases.
(a) Lentiviral vectors for constitutive, puromycin-selectable cell labelling with GLuc and CLuc. (b) GLuc and CLuc activity measured in the supernatant of cultures containing parental, GLuc+ and/or CLuc+ HCT116 cells as indicated (n=3). (c) Correlation of GLuc and CLuc activity in the cell culture supernatant with cell number (n=3). (d) Correlation of GLuc/CLuc activity ratio (G/C ratio) in the cell culture supernatant with mixing ratio of GLuc+ and CLuc+ cells. G/C ratio was normalized to the 1:1 mixture (n=5). (e) Stability of the normalized G/C ratio in the supernatant of long-term cultures (n=3). (f) Parental cisplatin (CDDP)-sensitive (H460par) and resistant (H460res) H460 cell clones were labelled with either GLuc (GLuc+H460par) or CLuc (CLuc+H460res), mixed in a 1:1 ratio, cultured 3 days in the presence or absence of CDDP (arrows) and monitored daily for GLuc/CLuc activity in the culture supernatant (n=3). Shown is the G/C ratio normalized to day 1. All data are presented as mean±s.d. unless indicated otherwise. Correlation is indicated by the Pearson’s correlation coefficient r.
Figure 2
Figure 2. Monitoring the dynamics of clonal evolution in vivo with secreted luciferases.
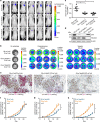
(a) Measurement of GLuc and CLuc in the plasma of mice bearing tumours arising from parental (par), GLuc+ or CLuc+ HCT116 cells. (b) Bioluminescence images of a single mouse with tumours of GLuc+ (right flank) and CLuc+ HCT116 cells (left flank) following administration of either coelenterazine (GLuc substrate) or vargulin (CLuc substrate). (c) Mice were subcutaneously injected with 1:1 mixtures of GLuc+ and CLuc+ HCT116 cells. GLuc and CLuc activity measured in blood plasma and tumour volume measured with calipers are shown. (d,e) Mice were subcutaneously injected with indicated mixtures of GLuc+ and CLuc+ HCT116 cells (n=10 mice per cell mixture). GLuc/CLuc activity ratio in the plasma of tumour-bearing mice correlates with injected cell ratio (d) and cell ratio determined by GLuc/CLuc-qPCR on genomic DNA isolated from explanted tumours (e). (fh) Mice were subcutaneously injected with a 1:1 mixture of GLuc+H460par and CLuc+H460res cells and treated with CDDP on day 7 and day 14. (f) GLuc and CLuc activity in the plasma (mean±s.e.m.). Tumour growth curves were analysed by two-way analysis of variance (*P<0.001). (g) GLuc/CLuc activity ratio in plasma (mean±95% confidence interval; *, P<0.01, nonparametric Kruskal–Wallis test and Dunn’s post test for multiple comparisons). (h) GLuc/CLuc activity ratio in tumour lysate (mean±95% confidence interval; *P<0.0001, nonparametric Kolmogorov–Smirnov test). Data are presented as mean±s.d. unless indicated otherwise. Correlation is indicated by the Pearson’s correlation coefficient r.
Figure 3
Figure 3. Monitoring evolution of shRNA-induced tumour heterogeneity under therapy.
(a) Lentiviral vectors for constitutive, coupled expression of shRNAs with GLuc or CLuc. (b) Western blot for p53, p21 (Cdkn1a) and β-actin (control) in HCT116 cells transduced with the indicated shRNA luciferase vectors following treatment with nutlin-3a. (c) GLuc/CLuc activity ratio in the supernatant of the indicated mixed cell cultures in the absence (left) and presence (right) of nutlin-3a. G/C ratios were normalized to the GLuc+nsh/CLuc+nsh control mixture (n=3). (d) Mice were injected subcutaneously with a 1:1 mixture of GLuc+shp53/CLuc+nsh HCT116 cells and treated with vehicle (left) or nutlin-3a (right) starting on day 13. Shown is the mean GLuc and CLuc activity in the plasma (±s.e.m.). Tumour growth curves were analysed by two-way analysis of variance (*P<0.005). (e) GLuc/CLuc plasma ratio (mean±95% confidence interval; *P<0.01, nonparametric Kruskal–Wallis test and Dunn’s post test for multiple comparisons). (f) Immunohistochemistry for p53 (brown) and GLuc (red) in representative tumours explanted from vehicle or nutlin-3a-treated mice. Large scale bars, 100 μm; small scale bars, 10 μm. All data are presented as mean±s.d. unless indicated otherwise.
Figure 4
Figure 4. Monitoring clonal evolution during metastasis.
(ah) Mice were injected i.v. with the MDA-MB-231 cell mixtures GLuc+nsh/CLuc+nsh, GLuc+shp53.1/CLuc+nsh or GLuc+shp53.5/CLuc+nsh. (a) Bioluminescence in vivo imaging of GLuc activity with coelenterazine. (b) GLuc (coelenterazine) and CLuc (vargulin) imaging of explanted lungs. (c) GLuc/CLuc activity ratios in lung lysates (mean±95% confidence interval; *P<0.01, nonparametric Kruskal–Wallis test and Dunn’s post test for multiple comparisons). (d) Western blot for knockdown efficiency of experimental shRNAs. (e) Immunohistochemical double staining for p53 (brown) and GLuc (red) in lungs explanted from mice injected with (left) GLuc+nsh/CLuc+nsh, (middle) GLuc+shp53.1/CLuc+nsh, and (right) GLuc+shp53.5/CLuc+nsh cell mixtures. Scale bars, 100 μm. (fh) GLuc/CLuc plasma activity (mean±s.e.m.). Tumour growth curves were analysed by two-way analysis of variance (*P<0.005).
Figure 5
Figure 5. Validating essential tumour genes in cell culture.
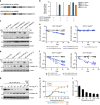
(a) Lentiviral vectors for dox-inducible, coupled expression of shRNAs with GLuc or CLuc. (b) GLuc and CLuc activity measured in the supernatant of uninduced (control) and induced (dox) mixtures of parental, GLuc+ and/or CLuc+ HCT116 cells. (c,d) Western blot of HCT116 cells transduced with the indicated shRNA-coupled luciferase vectors in the absence and presence of dox. (e,f) GLuc/CLuc activity ratio in the supernatant of the indicated dox-treated mixtures of shRNA+luciferase expressing HCT116 p53+/+ (left) and p53−/− (right) cells (n=3). (g) Western blot demonstrating dox titration of PLK1 knockdown. (h) Dox-dependent luciferase activities in supernatant of GLuc+shPLK1/CLuc+nsh cell mixture (n=3). Data were normalized to the dox-induced GLuc+nsh/CLuc+nsh reference mixture set as 100%. (i) Dox-dependency of the GLuc/CLuc activity ratio in the supernatant of the GLuc+shPLK1/CLuc+nsh cell mixture (n=3). All data are presented as mean±s.d. unless indicated otherwise.
Figure 6
Figure 6. Validating essential tumor genes in vivo.
(a) Mice were injected subcutaneously with HCT116 cell mixtures (GLuc+nsh/CLuc+nsh, GLuc+shMDM2.2/CLuc+nsh or GLuc+shPLK1.2/CLuc+nsh) and treated with dox starting on day 13. Shown are luciferase activities in blood plasma (mean±s.e.m.). (b) GLuc/CLuc activity ratio in tumour lysates (mean±95% confidence interval; *P<0.01, nonparametric Kolmogorov–Smirnov test). (c) GLuc/CLuc copy number ratio in genomic tumour DNA (mean±95% confidence interval; *P<0.01, nonparametric Kolmogorov–Smirnov test). (d) Correlation of G/C luciferase activity ratio in plasma with G/C copy number ratio in genomic tumor DNA. Correlation is indicated by the Pearson’s correlation coefficient r.

References

    1. Cairns J. Mutation selection and the natural history of cancer. Nature 255, 197–200 (1975). - PubMed
    1. Nowell P. C. The clonal evolution of tumor cell populations. Science 194, 23–28 (1976). - PubMed
    1. Greaves M. & Maley C. C. Clonal evolution in cancer. Nature 481, 306–313 (2012). - PMC - PubMed
    1. Burrell R. A., McGranahan N., Bartek J. & Swanton C. The causes and consequences of genetic heterogeneity in cancer evolution. Nature 501, 338–345 (2013). - PubMed
    1. Meacham C. E. & Morrison S. J. Tumour heterogeneity and cancer cell plasticity. Nature 501, 328–337 (2013). - PMC - PubMed

Publication types