. 2014 Aug;18(8):1571-9.
doi: 10.1111/jcmm.12304. Epub 2014 May 30.

Regulatory T cells modulate inflammation and reduce infarct volume in experimental brain ischaemia

Affiliations

Regulatory T cells modulate inflammation and reduce infarct volume in experimental brain ischaemia

David Brea et al. J Cell Mol Med. 2014 Aug.

Abstract

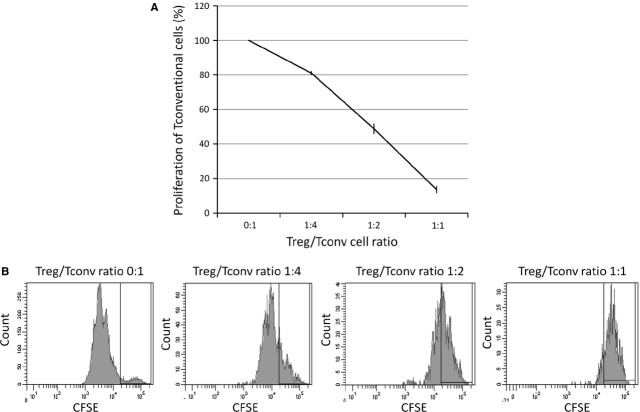
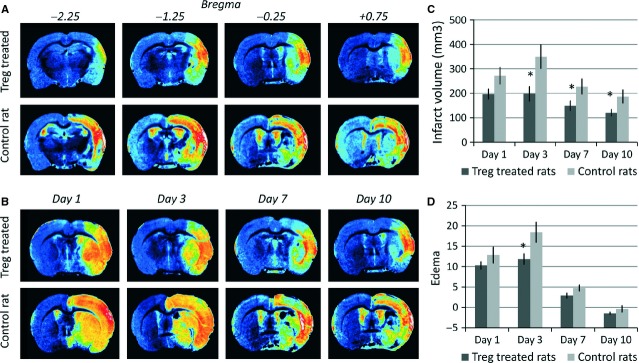
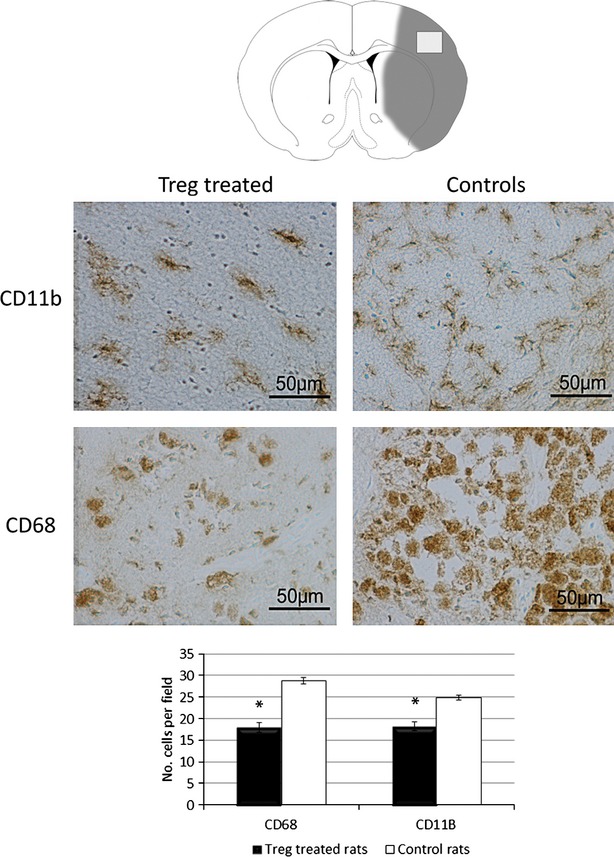
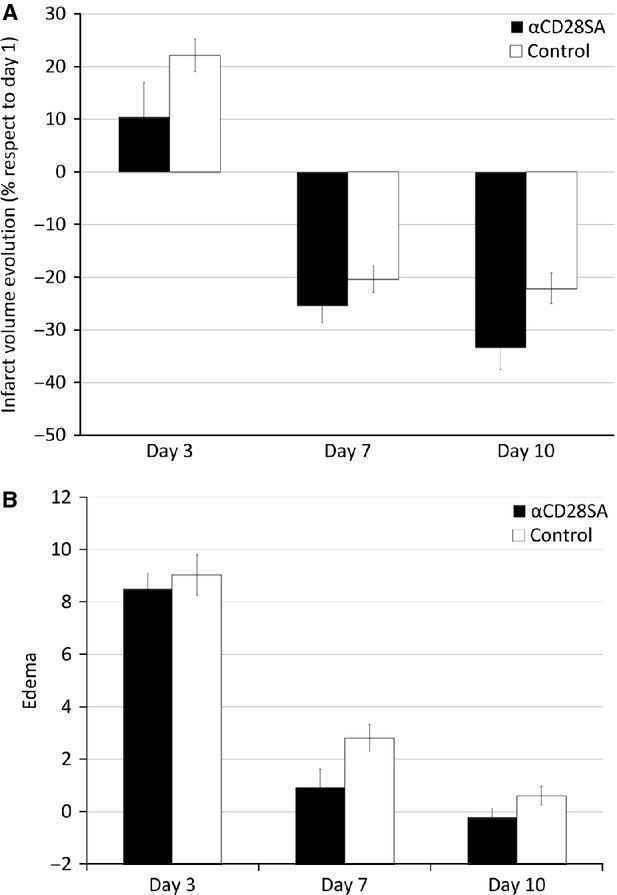
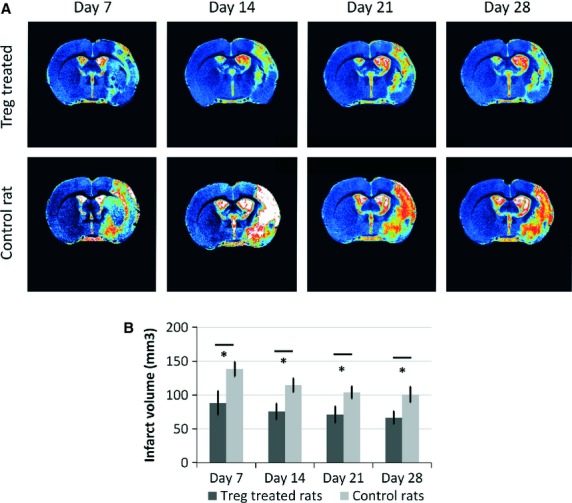
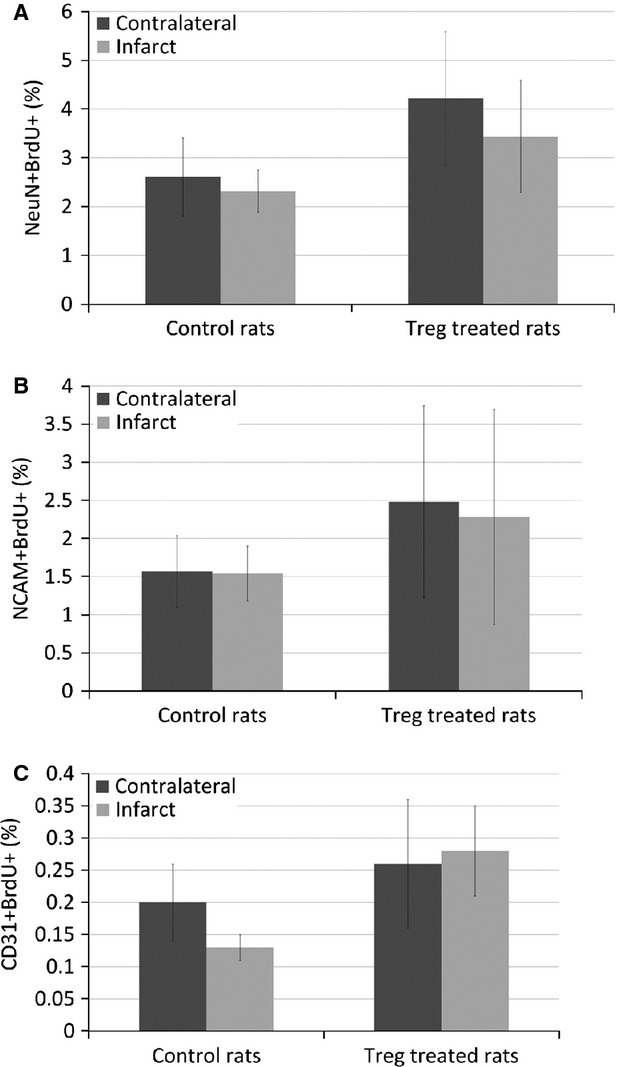
Brain ischaemia (stroke) triggers an intense inflammatory response predominately mediated by the accumulation of inflammatory cells and mediators in the ischaemic brain. In this context, regulatory T (Treg) cells, a subpopulation of CD4(+) T cells with immunosuppressive and anti-inflammatory properties, are activated in the late stages of the disease. To date, the potential therapeutic usefulness of Treg cells has not been tested. In this study, we aimed to investigate whether Treg cells exert protection/repair following stroke. Both the adoptive transfer of Treg cells into ischaemic rats and the stimulation of endogenous T-cell proliferation using a CD28 superagonist reduced the infarct size at 3-28 days following the ischaemic insult. Moreover, T cell-treated animals had higher levels of FoxP3 and lower levels of IL-1β, CD11b+ and CD68+ cells in the infarcted hemisphere when compared with control animals. However, T-cell treatment did not alter the rate of proliferation of NeuN-, NCAM- or CD31-positive cells, thereby ruling out neurogenesis and angiogenesis in protection. These results suggest that adoptive transfer of T cells is a promising therapeutic strategy against the neurological consequences of stroke.

Keywords: cerebrovascular disease/stroke; immunomodulation; inflammation; regulatory T cells.


Figures

Fig. 1
Fig. 1
Suppression of the proliferation of conventional T cells by expanded regulatory T cells. (A) Regulatory T cells were isolated from SD rats, expanded for 5 days, serially diluted and added to Tconv cell cultures at different Treg/Tconv ratios as indicated. The percentage of proliferation of Tconv cells was determined by CFSE fluorescence. (B) Mono-parametric representation of CFSE fluorescence of Tconv cells co-cultured with Treg cells at the indicated ratios. High fluorescence is indicative of low proliferation (ratio 1:1), while low fluorescence is indicative of high proliferation (ratio 0:1). The black gate in the graphic indicates the position of non-proliferating cells. The experiment was repeated three times.
Fig. 2
Fig. 2
Temporal profiles of infarct and oedema, as measured by MRI, in control and Treg-treated animals. (A) T2 weighted MR images of four consecutive slices (position relative to bregma indicated in mm on top of the images) of the ischaemic brain of a control and a treated animal, acquired 10 days after induction of the infarct. (B) T2 weighted MR images of the same animals showing the temporal evolution of the lesion for control and treated animals. (C) Infarct volumes of Treg-treated (n = 10) and control rats (n = 10) at days 1, 3, 7 and 10 after ischaemia. (D) Oedema measured for control (n = 10) and Treg-treated rats (n = 10) at days 1, 3, 7 and 10 post MCAO. Columns represent mean values, and error bars represent SEM (* indicates statistically significant differences; P < 0.05).
Fig. 3
Fig. 3
FoxP3 and inflammatory marker levels in rat brains. (A) FoxP3 expression in Treg-treated (n = 7) and control animals (n = 7), analysed for both the contralateral and infarcted hemispheres. FoxP3 was quantified from western blot images and normalized by actin intensity to eliminate small variations in loading between different samples. (B) Brain concentration of IL-1β in the contralateral and infarcted hemispheres of Treg-treated (n = 7) and control rats (n = 7), as determined by ELISA. In both graphs, columns represent mean values, and error bars represent SEM (* indicates statistically significant differences; P < 0.05).
Fig. 4
Fig. 4
Analysis of CD68+ and CD11b+ cells in the brains of Treg-treated and control rats. Images and graph representation of immunohistochemistry staining for CD11b (first row) and CD68 (second row) for both treatment groups (n = 3 for each group). Treg-treated animals showed a marked decrease of both inflammatory markers at day 10. Pictures were taken at 40 × (bar 50 μm).
Fig. 5
Fig. 5
Temporal profiles of infarct and oedema, as measured by MRI, in control and CD28-SA-treated animals. (A) Infarct volume (expressed as the percentage of change from day 1) and oedema (B) progression with time for CD28-SA-treated (n = 8) and control animals (n = 8).
Fig. 6
Fig. 6
Temporal profiles of infarct sizes and oedema in control and Treg-treated animals, as measured by MRI. (A) T2 weighted MR images showing the temporal evolution of the lesion for control and treated animals. (B) Infarct volume measured for control (n = 8) and Treg-treated rats (n = 8) at days 7, 14, 21 and 28 post-MCA occlusion. Columns represent mean values, and error bars represent SEM (* indicates statistically significant differences; P < 0.05).
Fig. 7
Fig. 7
Measurement of neuroblast division and endothelial cells division by flow cytometry. Quantification of NeuN+BrdU+ cells (A), NCAM+BrdU+ cells (B) and CD31+BrdU+ cells (C) in the contralateral and ipsilateral hemispheres of Treg-treated (n = 8) and control rats (n = 8).

References

    1. Shevach EM. CD4+ CD25+ suppressor T cells: more questions than answers. Nat Rev Immunol. 2002;2:389–400. - PubMed
    1. Brea D, Sobrino T, Ramos-Cabrer P, et al. Inflammatory and neuroimmunomodulatory changes in acute cerebral ischemia. Cerebrovasc Dis. 2009;27:48–64. - PubMed
    1. Yan J, Greer JM, Etherington K, et al. Immune activation in the peripheral blood of patients with acute ischemic stroke. J Neuroimmunol. 2009;206:112–7. - PubMed
    1. Emsley HC, Smith CJ, Gavin CM, et al. An early and sustained peripheral inflammatory response in acute ischaemic stroke: relationships with infection and atherosclerosis. J Neuroimmunol. 2003;139:93–101. - PubMed
    1. Rodríguez-Yáñez M, Castillo J. Role of inflammatory markers in brain ischemia. Curr Opin Neurol. 2008;21:353–7. - PubMed

Publication types

MeSH terms