

Visual account of protein investment in cellular functions
- PMID: 24889604
- PMCID: PMC4060655
- DOI: 10.1073/pnas.1314810111
Visual account of protein investment in cellular functions
Abstract
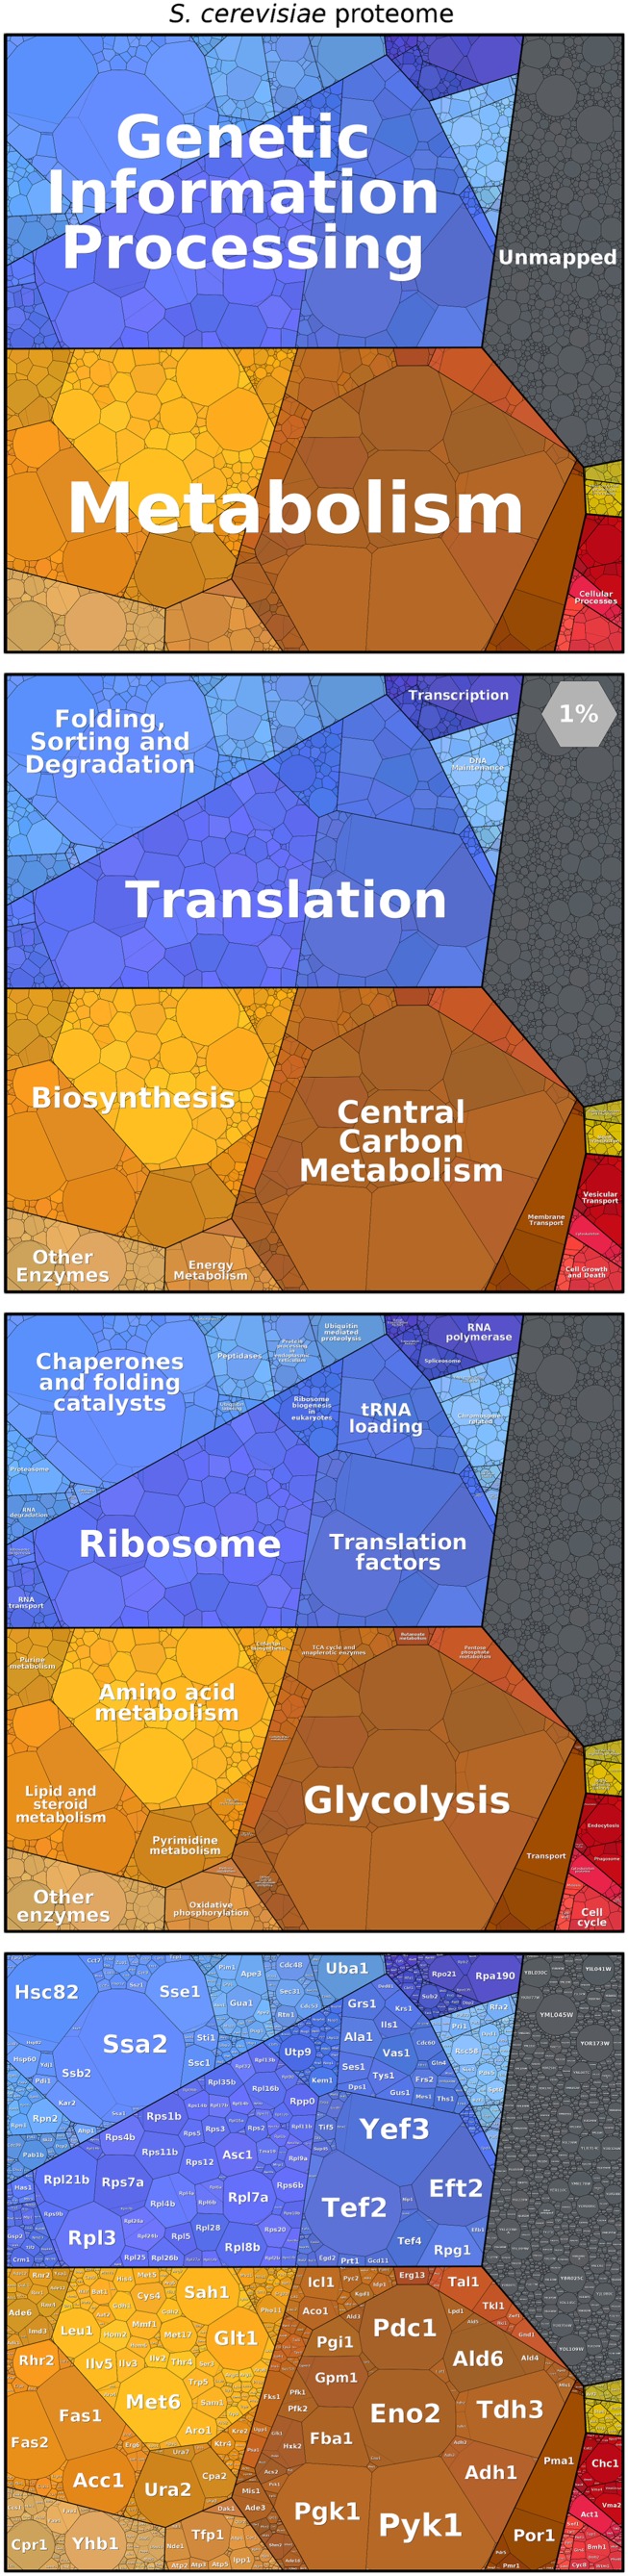
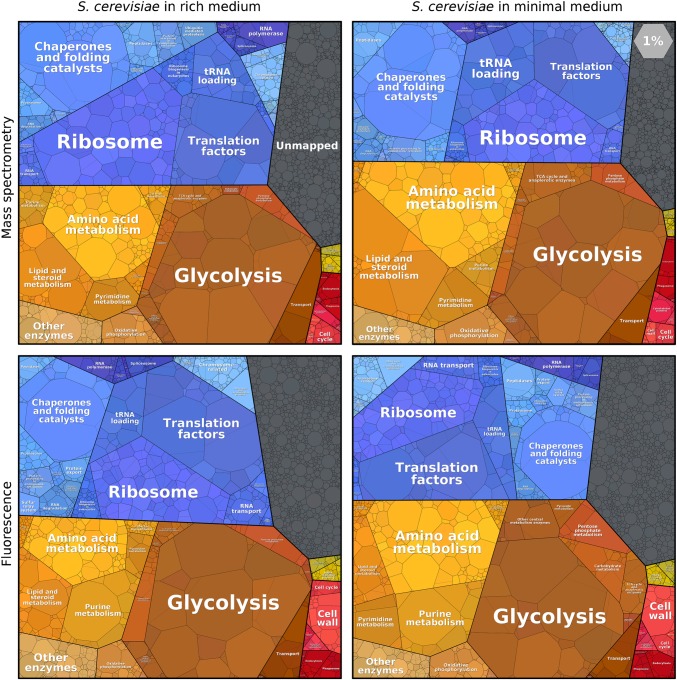
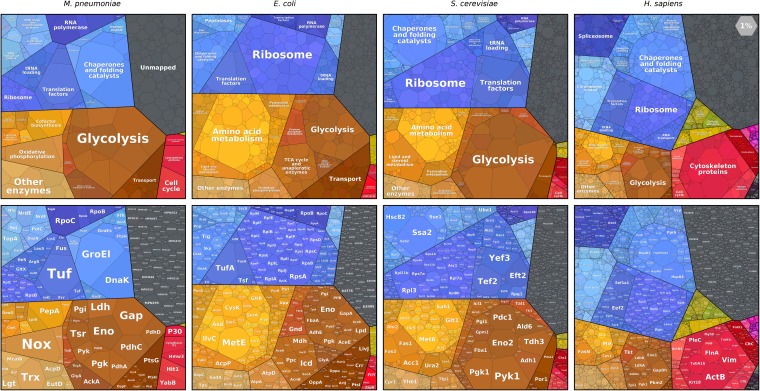
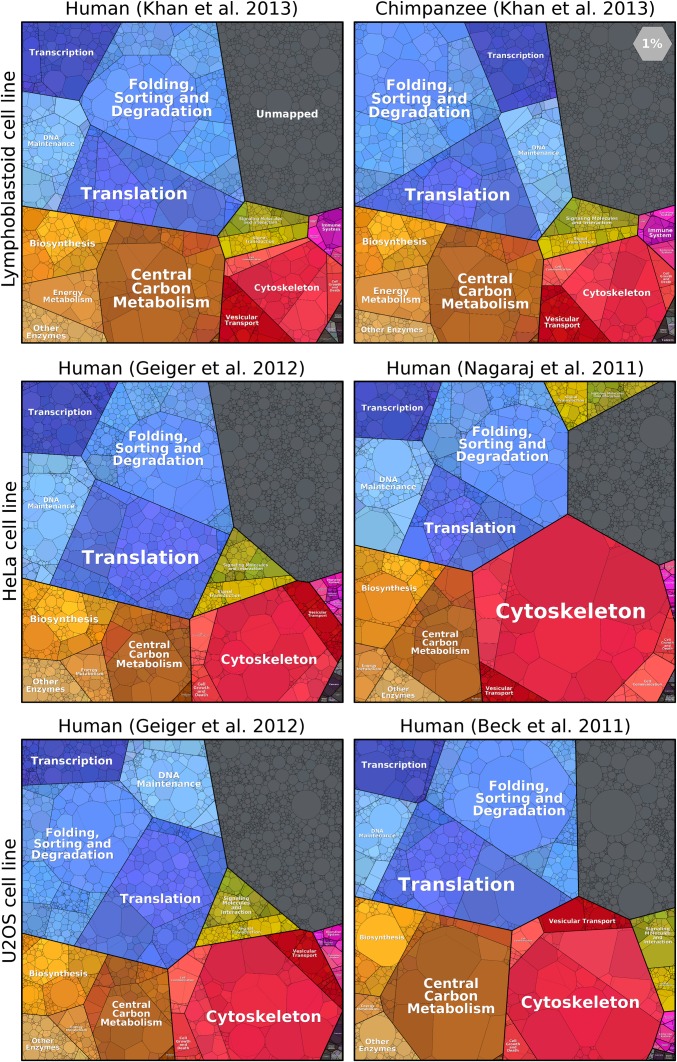
Proteomics techniques generate an avalanche of data and promise to satisfy biologists' long-held desire to measure absolute protein abundances on a genome-wide scale. However, can this knowledge be translated into a clearer picture of how cells invest their protein resources? This article aims to give a broad perspective on the composition of proteomes as gleaned from recent quantitative proteomics studies. We describe proteomaps, an approach for visualizing the composition of proteomes with a focus on protein abundances and functions. In proteomaps, each protein is shown as a polygon-shaped tile, with an area representing protein abundance. Functionally related proteins appear in adjacent regions. General trends in proteomes, such as the dominance of metabolism and protein production, become easily visible. We make interactive visualizations of published proteome datasets accessible at www.proteomaps.net. We suggest that evaluating the way protein resources are allocated by various organisms and cell types in different conditions will sharpen our understanding of how and why cells regulate the composition of their proteomes.
Keywords: Voronoi treemap; cell resource allocation; cellular economy; functional classification; mass spectrometry.
Conflict of interest statement
Conflict of interest statement: J.B. is working as research scientist at the Institute for Microbiology of the Ernst-Moritz-Arndt University of Greifswald and as chief scientist with Decodon GmbH and has financial interest in the company that commercializes software tools for proteomics, including Proteomaps.
Figures
References
-
- Pedersen S, Bloch PL, Reeh S, Neidhardt FC. Patterns of protein synthesis in E. coli: A catalog of the amount of 140 individual proteins at different growth rates. Cell. 1978;14(1):179–190. - PubMed
-
- Newman JRS, et al. Single-cell proteomic analysis of S. cerevisiae reveals the architecture of biological noise. Nature. 2006;441(7095):840–846. - PubMed
-
- Ghaemmaghami S, et al. Global analysis of protein expression in yeast. Nature. 2003;425(6959):737–741. - PubMed
-
- Lu P, Vogel C, Wang R, Yao X, Marcotte EM. Absolute protein expression profiling estimates the relative contributions of transcriptional and translational regulation. Nat Biotechnol. 2007;25(1):117–124. - PubMed
-
- de Godoy LMF, et al. Comprehensive mass-spectrometry-based proteome quantification of haploid versus diploid yeast. Nature. 2008;455(7217):1251–1254. - PubMed
Publication types
MeSH terms
Substances
Grants and funding
LinkOut - more resources
Full Text Sources
Other Literature Sources
Molecular Biology Databases
