. 2014 Jun 17;111(24):8832-7.
doi: 10.1073/pnas.1405723111. Epub 2014 Jun 2.

Contact inhibition and high cell density deactivate the mammalian target of rapamycin pathway, thus suppressing the senescence program

Affiliations

Contact inhibition and high cell density deactivate the mammalian target of rapamycin pathway, thus suppressing the senescence program

Olga V Leontieva et al. Proc Natl Acad Sci U S A. .

Abstract

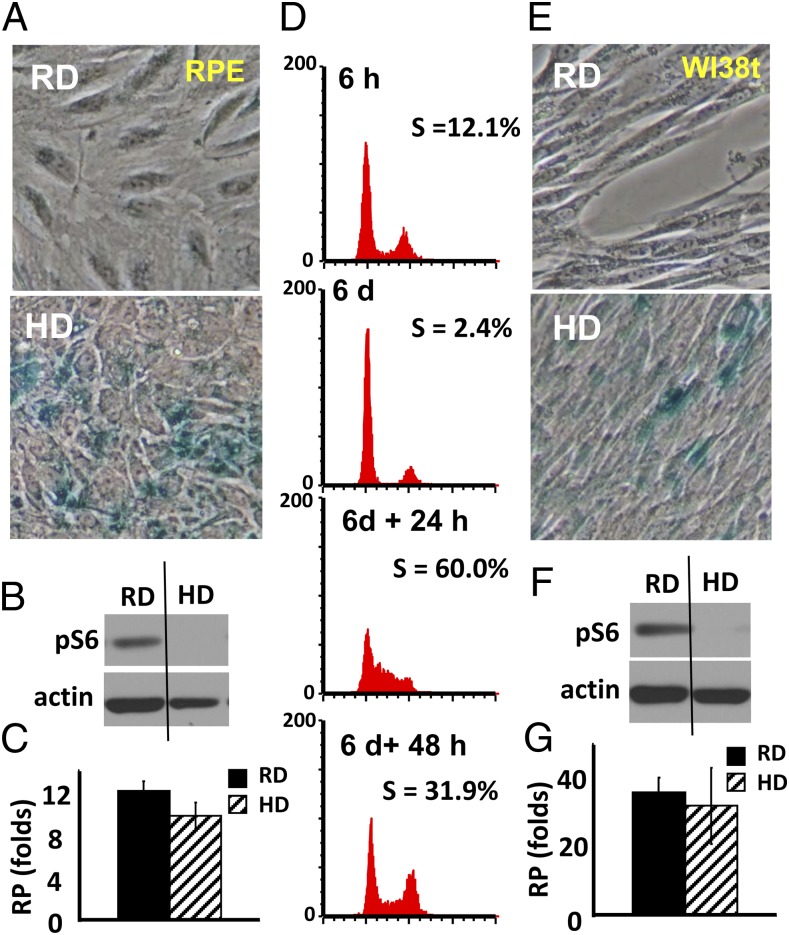
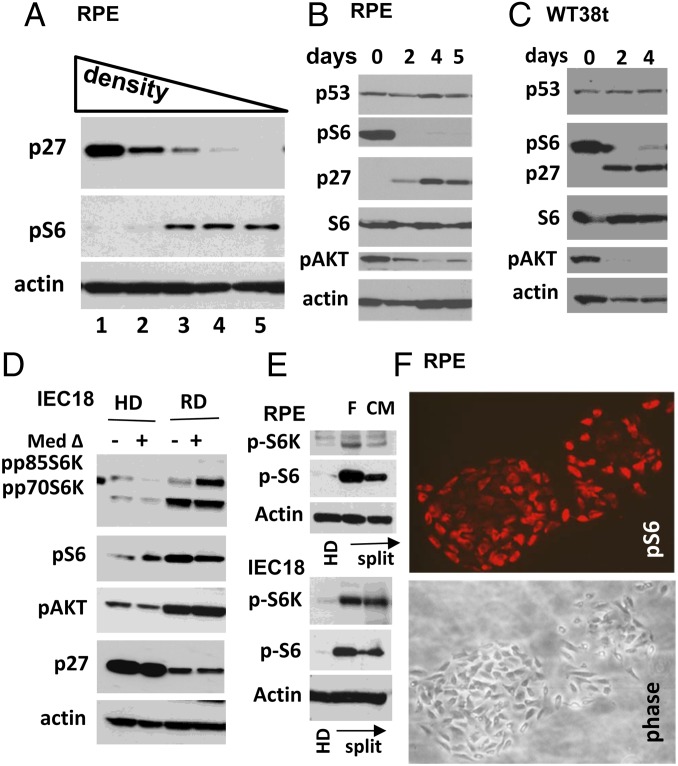
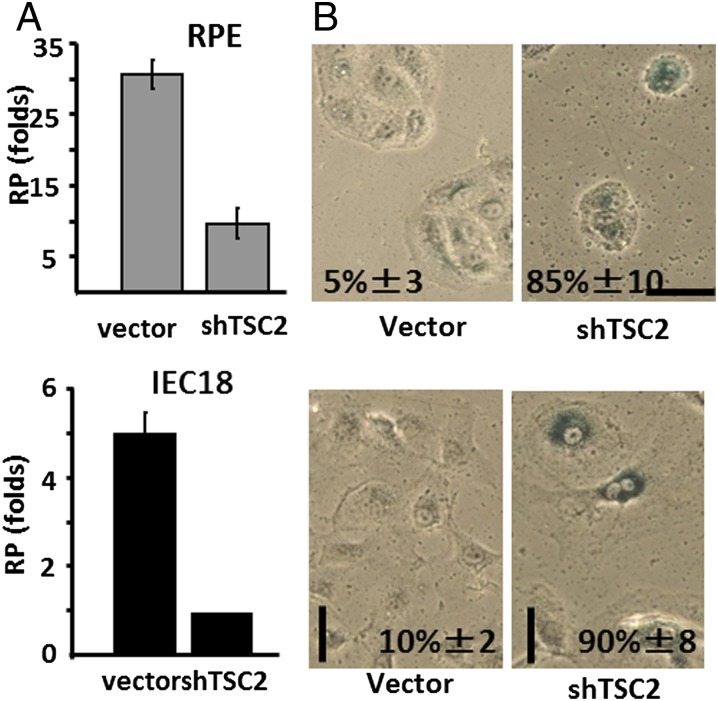
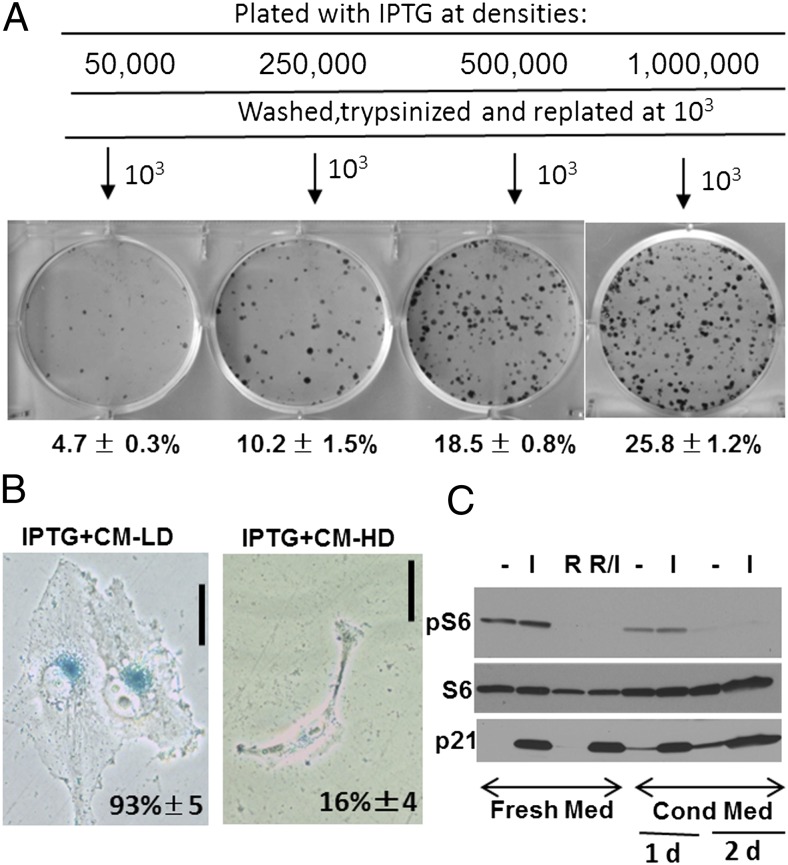
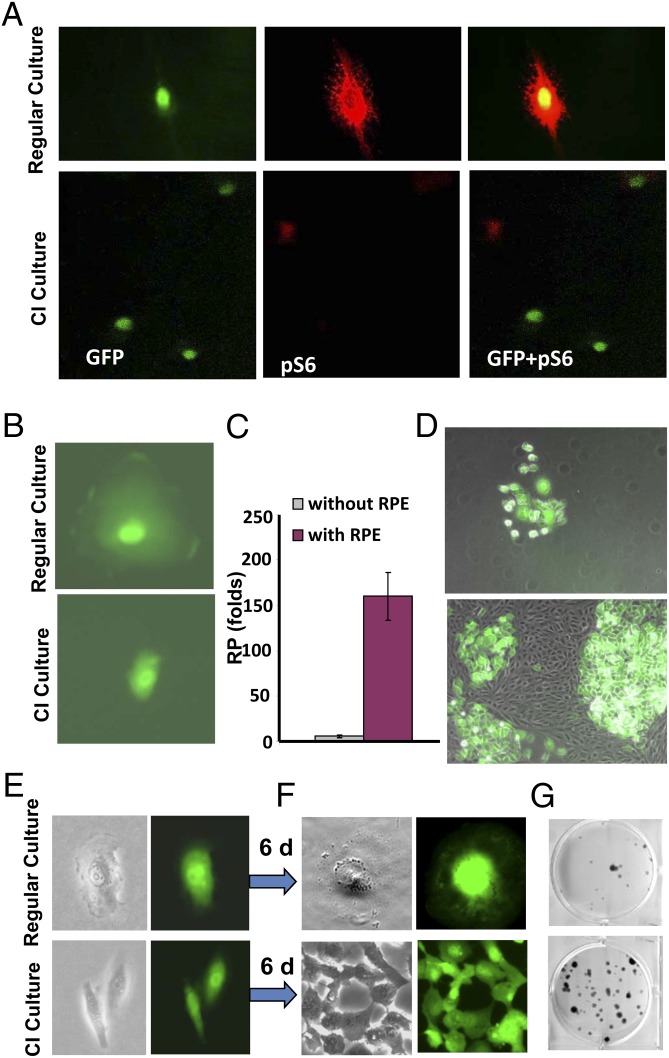
During cell cycle arrest caused by contact inhibition (CI), cells do not undergo senescence, thus resuming proliferation after replating. The mechanism of senescence avoidance during CI is unknown. Recently, it was demonstrated that the senescence program, namely conversion from cell cycle arrest to senescence (i.e., geroconversion), requires mammalian target of rapamycin (mTOR). Geroconversion can be suppressed by serum starvation, rapamycin, and hypoxia, which all inhibit mTOR. Here we demonstrate that CI, as evidenced by p27 induction in normal cells, was associated with inhibition of the mTOR pathway. Furthermore, CI antagonized senescence caused by CDK inhibitors. Stimulation of mTOR in contact-inhibited cells favored senescence. In cancer cells lacking p27 induction and CI, mTOR was still inhibited in confluent culture as a result of conditioning of the medium. This inhibition of mTOR suppressed p21-induced senescence. Also, trapping of malignant cells among contact-inhibited normal cells antagonized p21-induced senescence. Thus, we identified two nonmutually exclusive mechanisms of mTOR inhibition in high cell density: (i) CI associated with p27 induction in normal cells and (ii) conditioning of the medium, especially in cancer cells. Both mechanisms can coincide in various proportions in various cells. Our work explains why CI is reversible and, most importantly, why cells avoid senescence in vivo, given that cells are contact-inhibited in the organism.


Conflict of interest statement

The authors declare no conflict of interest.

Figures

Fig. 1.
Fig. 1.
Characterization of reversible CI of normal cells. (A) β-Gal staining. RPE cells were plated at 1 million (HD) and 100,000 (RD) per well in six-well plates. After 6 d in culture, cells were packed in wells plated at 1 million (HD) and were confluent (with some spaces in monolayers) in wells plated at 100,000 (RD). (B) Immunoblot analysis. RPE cells were plated at RD and HD (A) and lysed after 6 d in culture. (C) RP: RPE cells were plated at RD and HD (A) and, after 6 d in culture, cells were split and replated at LD to regrow. After 8 d, cells were counted. (D) Cell cycle distribution: RPE cells were plated at HD and analyzed after 6 h (6 h initial condition) and 6 d in culture by flow cytometry. In parallel, a 6-d culture was replated at LD and cell cycle distribution was analyzed after 24 h and 48 h in culture. (E) β-gal staining. WI38t cells were plated at HD and RD in six-well plates. After 6 d in culture, cells were packed in wells plated at HD and were confluent (with some spaces in monolayers) in wells plated at RD. (F) Immunoblot analysis: WI38t cells were plated at RD and HD (A) and lysed after 6 d in culture. (G) RP: WI38t cells were plated at RD and HD (E) and, after 6 d in culture, cells were split and replated at LD and allowed to regrow. After 7 d, cells were counted.
Fig. 2.
Fig. 2.
Inhibition of the mTOR pathway in CI associated with p27 induction. (A) Immunoblot analysis: RPE cells were plated at a range of densities (shown from highest to lowest) and lysed after 2 d in culture. (B and C) Immunoblot analysis: RPE cells (B) and WI38t cells (C) were plated at HD and lysed on the days indicated. (D) Immunoblot analysis: IEC18 (rat intestinal epithelial) cells were plated at HD and RD. After 4 d, cells were lysed. In a parallel set, culture media were changed to fresh medium for 1 h before lysis (Med Δ). (E) RPE and IEC18 cells were plated at HD. After 2 d in culture, one set of cells was lysed and a second set was replated at LD into fresh medium (marked as “F”) or CM collected from the respective HD culture. At 24 h after replating, cells were lysed for immunoblotting. (F) Immunofluorescence: RPE cells were grown in colonies and stained for p-S6. Cells were photographed under light and fluorescence microscopes.
Fig. 3.
Fig. 3.
Effect of shTSC2 on senescence of contact-inhibited cells. RPE (A) and IEC18 (B) cells were infected with lentivirus pLKO vector or pLKO-shTSC2 and then were plated at HD. After 4 d, cells were replated at LD and allowed to grow. RP was determined by fold increase in cell number after replating: RPE cells were counted after 8 d of regrowth, and IEC18 cells were counted after 3 d of regrowth. Replicate sets of replated RPE and IEC18 cells were stained for β-gal after 3 d of regrowth. Percentage of senescent cells was determined by counting β-gal–positive cells in three separate fields. Data presented as mean ± SD. (Scale bar: 100 µm.)
Fig. 4.
Fig. 4.
Effects of high-density and CM on p21-induced senescence in HT-p21 cells. (A) Effect of cell density on senescence in HT-p21 cells. RP: HT-p21 cells were treated with IPTG at different densities (as indicated). After 3 d, cells were trypsinized, and 1,000 viable cells were replated in fresh medium without IPTG. Colonies were stained after 8 d. Number of colonies is presented as percentage of 1,000 seeded cells ± SD. (B) β-Gal staining: CM was collected from HT-p21 cells growing for 3 d at LD (CM-LD, 10,000 per well in a six-well plate) or HD (CM-HD, 1,000,000 per well in a six-well plate). Then, HT-p21 cells were plated at LD and treated with IPTG in CM-HD or CM-LD. After a 3-d treatment, cells were stained for β-gal. Percentage of senescent cells was determined by counting β-gal–positive cells in three separate fields. Data presented as mean ± SD. (Scale bar: 100 µm.) (C) Immunoblot analysis: HT-p21 cells in RD were treated with IPTG, when indicated, in fresh medium or CM-HD (CM-HD collected from HD culture of HT-p21 cells after 1 d and 2 d in culture) and lysed 24 h later. I, IPTG 50 µg/mL; R, rapamycin 500 nM.
Fig. 5.
Fig. 5.
CI of cancer HT-p21 cells in confluent cultures of RPE cells prevents IPTG-induced senescence. (A) HT-p21 cells express GFP and can be distinguished from RPE cells under fluorescence microscopy. HT-p21-9 cells were plated at LD alone (regular culture) or together with HD RPE cells (number of plated HT-p21 cells was ∼5% of the number of RPE cells, i.e., 2,500:50,000; CI, culture) and treated with IPTG. After 3 d, cells were fixed and stained for pS6. Cells were photographed under a fluorescence microscope. (BD) A small number of HT-p21 cells were plated together with a high number of RPE cells as in A and treated with IPTG. After 3 d, cells were trypsinized and replated: One thousand HT-p21 cells were plated per well in six-well plates. (B) On day 1, green (HT-p21) cells were photographed. (C) RP: after 7 d, green cells were counted. Data are presented as fold increase in number of HT-p21 (green) relative to initially plated numbers. (D) After 7 d, cells were photographed under light and fluorescence microscopes. Overlaid images display green colonies of HT-p21 cells on the top of nonfluorescent monolayer of RPE cells. (EG) HT-p21 cells were plated and treated with IPTG in regular culture (alone) or together with RPE cells (CI culture) as in BD. After 3 d, treatment cells were sorted for GFP by using flow cytometry, and green cells were plated at 500 per well in 12-well plates in drug-free medium. Colonies were allowed to grow for 6 d and stained with crystal violet. (E) Cells were photographed under light and fluorescence microscopes on day 2 after plating. (F) Cells were photographed 6 d after replating. (G) RP: colonies of HT-p21 cells treated with IPTG in regular culture or in the presence of HD RPE cells (CI culture), then sorted for GFP and grown in drug-free medium for 12 d.

Similar articles

Cited by

References

    1. Serrano M, Lin AW, McCurrach ME, Beach D, Lowe SW. Oncogenic ras provokes premature cell senescence associated with accumulation of p53 and p16INK4a. Cell. 1997;88(5):593–602. - PubMed
    1. Ferbeyre G, et al. Oncogenic ras and p53 cooperate to induce cellular senescence. Mol Cell Biol. 2002;22(10):3497–3508. - PMC - PubMed
    1. Blagosklonny MV. Cell senescence and hypermitogenic arrest. EMBO Rep. 2003;4(4):358–362. - PMC - PubMed
    1. Deng Q, Liao R, Wu BL, Sun P. High intensity ras signaling induces premature senescence by activating p38 pathway in primary human fibroblasts. J Biol Chem. 2004;279(2):1050–1059. - PubMed
    1. Demidenko ZN, Blagosklonny MV. Growth stimulation leads to cellular senescence when the cell cycle is blocked. Cell Cycle. 2008;7(21):3355–3361. - PubMed

Publication types

Substances