. 2014 Jun 17;111(24):8753-8.
doi: 10.1073/pnas.1323922111. Epub 2014 Jun 2.

Antarctic sea ice control on ocean circulation in present and glacial climates

Affiliations

Antarctic sea ice control on ocean circulation in present and glacial climates

Raffaele Ferrari et al. Proc Natl Acad Sci U S A. .

Abstract

In the modern climate, the ocean below 2 km is mainly filled by waters sinking into the abyss around Antarctica and in the North Atlantic. Paleoproxies indicate that waters of North Atlantic origin were instead absent below 2 km at the Last Glacial Maximum, resulting in an expansion of the volume occupied by Antarctic origin waters. In this study we show that this rearrangement of deep water masses is dynamically linked to the expansion of summer sea ice around Antarctica. A simple theory further suggests that these deep waters only came to the surface under sea ice, which insulated them from atmospheric forcing, and were weakly mixed with overlying waters, thus being able to store carbon for long times. This unappreciated link between the expansion of sea ice and the appearance of a voluminous and insulated water mass may help quantify the ocean's role in regulating atmospheric carbon dioxide on glacial-interglacial timescales. Previous studies pointed to many independent changes in ocean physics to account for the observed swings in atmospheric carbon dioxide. Here it is shown that many of these changes are dynamically linked and therefore must co-occur.

Keywords: Southern Ocean; carbon cycle; ice age; ocean circulation; paleoceanography.


Conflict of interest statement

The authors declare no conflict of interest.

Figures
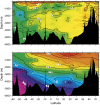
Fig. 1.
Fig. 1.
Contour maps of δ13C for a section in the Western Atlantic (5) based on water samples for the modern climate (Upper) and benthic foraminiferal stable isotope data using a variety of Cibicidoides spp. for the LGM (Lower). The glacial reconstruction documents the shoaling of North Atlantic Deep Water to about 1,500 m, and the expansion and northward penetration of Southern Ocean Deep Water/Antarctic Bottom Water.
Fig. 2.
Fig. 2.
Zonally averaged neutral density surfaces based on the WOCE hydrographic atlas (23). The vertical line marks the 45°S latitude, the northernmost latitude reached by the Antarctic Circumpolar Current. The dashed line is the theoretical prediction based on Eq. 1 for the shape of the density surface 27.9 kg m−3 outcropping at the summer sea ice edge in the Southern Hemisphere.
Fig. 3.
Fig. 3.
Annual mean buoyancy flux from a state estimate that combines 3 y of available observations with an ocean model (26). The black line denotes the 70% quantiles of annual mean sea ice concentration, essentially the area of the ocean covered by ice 70% of the time. The change in sign of the buoyancy flux just north of the Antarctic continent is roughly colocated with the 70% quantile of sea ice coverage.
Fig. 4.
Fig. 4.
(Upper) Schematic of the overturning circulation for the modern climate. The ribbons represent a zonally averaged view of the circulation of the major water masses; blue is AABW, green is NADW, red are IDW and PDW, and orange are Antarctic Intermediate Waters. The dashed vertical lines represent mixing-driven upwelling of AABW into NADW and IDW/PDW respectively. There is also some mixing between NADW and IDW/PDW in the Southern Ocean. The dashed black line represents the isopycnal that separates the upper and lower overturning branches present in the Southern Ocean. 1 is the distance between the northernmost latitude reached by the ACC, indicated by a solid gray line, and the quasi-permanent sea ice line. The ragged gray line is the crest of the main bathymetric features of the Pacific and Indian ocean basins: mixing is enhanced below this line. (Lower) Schematic of the overturning circulation for the LGM. The extent of the quasi-permanent sea ice line has shifted equatorward compared with modern climate (2<1). Mixing-driven upwelling of abyssal waters is confined below 2 km and it cannot lift waters high enough to upwell north of the ice line. As a result the abyssal overturning circulation closes on itself, leaving above a small overturning cell of North Atlantic waters.
Fig. 5.
Fig. 5.
The surface buoyancy flux from two CCSM3 simulations run for modern and LGM climates (33). The flux is in color with blue representing negative fluxes. The black lines are the 70% and 80% quantiles of annual mean sea ice concentration. The gray line is the position of the −2 °C air temperature isoline at 2 m in summer. The area of negative buoyancy flux, the −2 °C isoline and the extent of quasi-permanent sea ice shift poleward in excess of 5° latitude at the LGM.

References

    1. Schneider von Deimling T, Ganopolski A, Held H, Rahmstorf S. How cold was the last glacial maximum? Geophys Res Lett. 2006;33(14):L14709.
    1. Monnin E, et al. Atmospheric CO2 concentrations over the last glacial termination. Science. 2001;291(5501):112–114. - PubMed
    1. Gersonde R, Crosta X, Abelmann A, Armand L. Sea-surface temperature and sea ice distribution of the southern ocean at the EPILOG last glacial maximum—A circum-antarctic view based on siliceous microfossil records. Quat Sci Rev. 2005;24(7-9):869–896.
    1. MARGO Project Members Constraints on the magnitude and patterns of ocean cooling at the last glacial maximum. Nat Geosci. 2009;2:127–132.
    1. Curry WB, Oppo DW. Glacial water mass geometry and the distribution of δ13 C of CO2 in the western Atlantic Ocean. Paleoceanography. 2005;20(1):PA1017.

Publication types