. 2014 Jun 2:7:30.
doi: 10.1186/1755-8794-7-30.

Imaging genomic mapping of an invasive MRI phenotype predicts patient outcome and metabolic dysfunction: a TCGA glioma phenotype research group project

Affiliations

Imaging genomic mapping of an invasive MRI phenotype predicts patient outcome and metabolic dysfunction: a TCGA glioma phenotype research group project

Rivka R Colen et al. BMC Med Genomics. .

Abstract

Background: Invasion of tumor cells into adjacent brain parenchyma is a major cause of treatment failure in glioblastoma. Furthermore, invasive tumors are shown to have a different genomic composition and metabolic abnormalities that allow for a more aggressive GBM phenotype and resistance to therapy. We thus seek to identify those genomic abnormalities associated with a highly aggressive and invasive GBM imaging-phenotype.

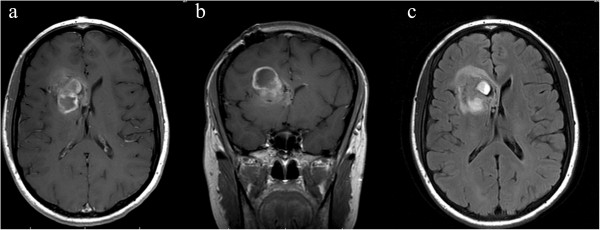
Methods: We retrospectively identified 104 treatment-naïve glioblastoma patients from The Cancer Genome Atlas (TCGA) whom had gene expression profiles and corresponding MR imaging available in The Cancer Imaging Archive (TCIA). The standardized VASARI feature-set criteria were used for the qualitative visual assessments of invasion. Patients were assigned to classes based on the presence (Class A) or absence (Class B) of statistically significant invasion parameters to create an invasive imaging signature; imaging genomic analysis was subsequently performed using GenePattern Comparative Marker Selection module (Broad Institute).

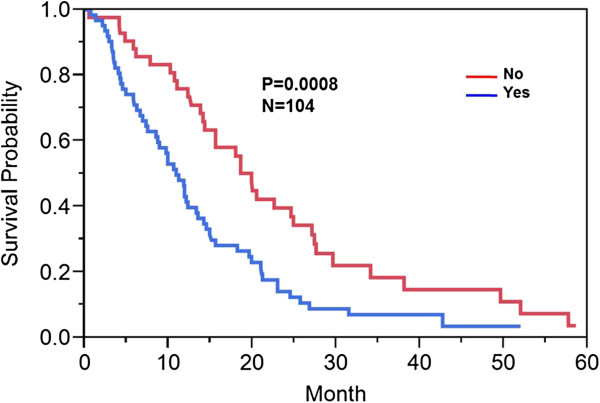
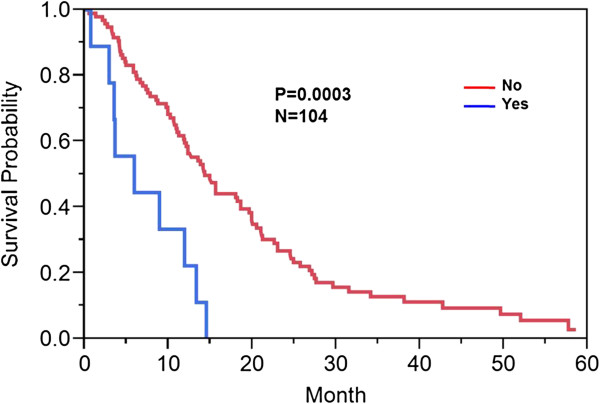
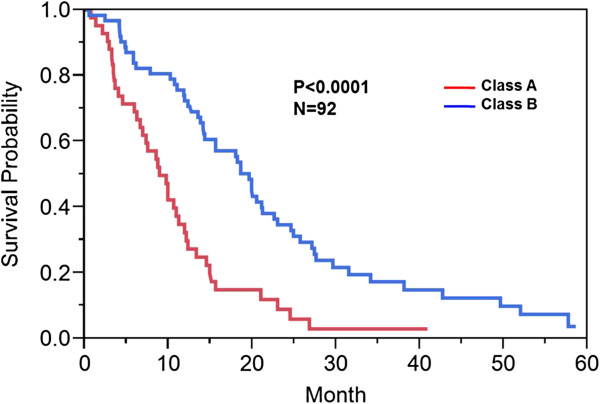
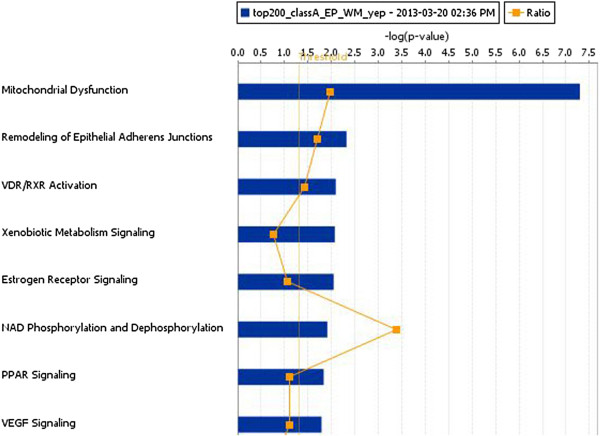
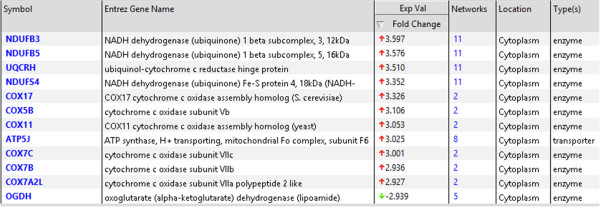
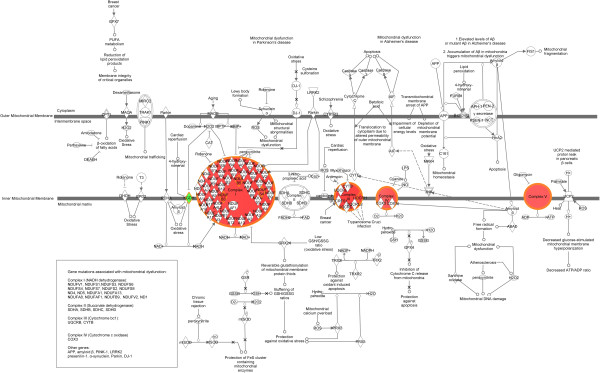
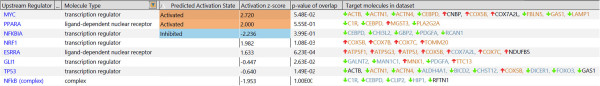
Results: Our results show that patients with a combination of deep white matter tracts and ependymal invasion (Class A) on imaging had a significant decrease in overall survival as compared to patients with absence of such invasive imaging features (Class B) (8.7 versus 18.6 months, p < 0.001). Mitochondrial dysfunction was the top canonical pathway associated with Class A gene expression signature. The MYC oncogene was predicted to be the top activation regulator in Class A.

Conclusion: We demonstrate that MRI biomarker signatures can identify distinct GBM phenotypes associated with highly significant survival differences and specific molecular pathways. This study identifies mitochondrial dysfunction as the top canonical pathway in a very aggressive GBM phenotype. Thus, imaging-genomic analyses may prove invaluable in detecting novel targetable genomic pathways.


Figures

Figure 1
Figure 1
Image example of qualitative invasive phenotype: ependymal extension. 33 year old female patient with right frontal GBM. (a) Axial and (b) coronal post-contrast T1-weighted images demonstrate extension of enhancing tumor into the ependymal region of the frontal horn of the right lateral ventricle. (c) Axial FLAIR image demonstrates non-enhancing tumor as well to extend to the ependymal region.
Figure 2
Figure 2
Kaplan Meier survival curve: Deep white matter tract [DWMT] involvement. Kaplan Meier method was used to compute overall median survival. Those who had involvement versus no involvement of the DWMT demonstrated a median overall survival of 10.9 months versus 19.9 months (p < 0.0008).
Figure 3
Figure 3
Kaplan Meier survival curve: enhancing tumor across midline/corpus callosum. Kaplan Meier method was used to compute overall median survival. Those who had enhancement across the midline versus those patients with absence of enhancement across the midline demonstrated a median overall survival of 9 months versus 14.3 months (p < 0.0003).
Figure 4
Figure 4
Kaplan Meier survival curve: Ependymal [EP] involvement. Kaplan Meier method was used to compute overall median survival. Those who had ependymal tumor involvement versus no ependymal tumor involvement demonstrated an overall survival of 10.6 versus 18.6 months (p = 0.0018).
Figure 5
Figure 5
Kaplan Meier survival curve: Class A versus Class B. Kaplan Meier method was used to compute overall median survival. Those patients in Class A (invasive phenotypes) versus those patients in Class B (without invasive features or only one invasive feature) demonstrated an overall survival of 8.7 versus 18.6 months (p<0.001).
Figure 6
Figure 6
Canonical pathways associated with Class A patients. Canonical pathway analysis was performed using IPA. The top canonical pathway was mitochondrial dysfunction in Class A patients with invasive phenotypes.
Figure 7
Figure 7
The molecules associated with the mitochondrial dysfunctional canonical pathway. In the fold change column, highly up-regulated genes (red color) and a single down-regulated gene (green color) were presented.
Figure 8
Figure 8
Mitochondrial pathway demonstrating location of dysfunctional molecules along its spectrum. Up-regulated genes were labeled with red color and down-regulated gene was labeled with green color.
Figure 9
Figure 9
Transcriptional factor analysis. Transcriptional factor analysis was performed using IPA to predict the potential transcription factors involved and their activation or inhibition states in Class A versus Class B groups. MYC and PPARA were predicted to be activated and NFKB1A was predicted to be inhibited.
Figure 10
Figure 10
Link between NFKBIA and EGFR pathway in Glioblastoma. The relationship between EGFR and NF-kB signaling was performed using IPA Path Designer tool. Solid line indicates direct biological relationship. Dashed line indicates indirect biological relationship. The relationship between molecules were supported by IPA knowledge base. EGF signaling to NF-kB is affected by NFKBIA inhibition.

References

    1. Quant EC, Wen PY. Novel medical therapeutics in glioblastomas, including targeted molecular therapies, current and future clinical trials. Neuroimaging Clin N Am. 2010;7:425–448. doi: 10.1016/j.nic.2010.04.007. - DOI - PubMed
    1. (TCGA) TCGA. Comprehensive genomic characterization defines human glioblastoma genes and core pathways. Nature. 2008;7:1061–1068. doi: 10.1038/nature07385. - DOI - PMC - PubMed
    1. Stupp R, Mason WP, van den Bent MJ, Weller M, Fisher B, Taphoorn MJ, Belanger K, Brandes AA, Marosi C, Bogdahn U, Curschmann J, Janzer RC, Ludwin SK, Gorlia T, Allgeier A, Lacombe D, Cairncross JG, Eisenhauer E, Mirimanoff RO. Radiotherapy plus concomitant and adjuvant temozolomide for glioblastoma. N Engl J Med. 2005;7:987–996. doi: 10.1056/NEJMoa043330. - DOI - PubMed
    1. Salk JJ, Fox EJ, Loeb LA. Mutational heterogeneity in human cancers: Origin and consequences. Annu Rev Pathol. 2010;7:51–75. doi: 10.1146/annurev-pathol-121808-102113. - DOI - PMC - PubMed
    1. Gerlinger M, Rowan AJ, Horswell S, Larkin J, Endesfelder D, Gronroos E, Martinez P, Matthews N, Stewart A, Tarpey P, Varela I, Phillimore B, Begum S, McDonald NQ, Butler A, Jones D, Raine K, Latimer C, Santos CR, Nohadani M, Eklund AC, Spencer-Dene B, Clark G, Pickering L, Stamp G, Gore M, Szallasi Z, Downward J, Futreal PA, Swanton C. Intratumor heterogeneity and branched evolution revealed by multiregion sequencing. N Engl J Med. 2012;7:883–892. doi: 10.1056/NEJMoa1113205. - DOI - PMC - PubMed

Publication types

MeSH terms

Substances