. 2014 Jun 3:13:137.
doi: 10.1186/1476-4598-13-137.

Estrogen promotes stemness and invasiveness of ER-positive breast cancer cells through Gli1 activation

Affiliations

Estrogen promotes stemness and invasiveness of ER-positive breast cancer cells through Gli1 activation

Ying Sun et al. Mol Cancer. .

Abstract

Background: Although long-term estrogen (E2) exposure is associated with increased breast cancer (BC) risk, and E2 appears to sustain growth of BC cells that express functional estrogen receptors (ERs), its role in promoting BC stem cells (CSCs) remains unclear. Considering that Gli1, part of the Sonic hedgehog (Shh) developmental pathway, has been shown to mediate CSCs, we investigated whether E2 and Gli1 could promote CSCs and epithelial-mesenchymal transition (EMT) in ER+ BC cell lines.

Methods: We knocked down Gli1 in several BC cells using a doxycycline-controlled vector, and compared Gli1-knockdown cells and Gli1+ cells in behavior and expression of ER, Gli1, ALDH1 (BC-CSC marker), Shh, Ptch1 (Shh receptor) and SOX2, Nanog and Bmi-1 (CSC-associated transcriptions factors), using PCR; tissue microarrays, western blot; chromatin immunoprecipitation q-PCR, confocal immunofluorescence microscopy; fluorescence-activated cell sorting; annexin-flow cytometry (for apoptosis); mammosphere culture; and colony formation, immunohistochemistry, Matrigel and wound-scratch assays.

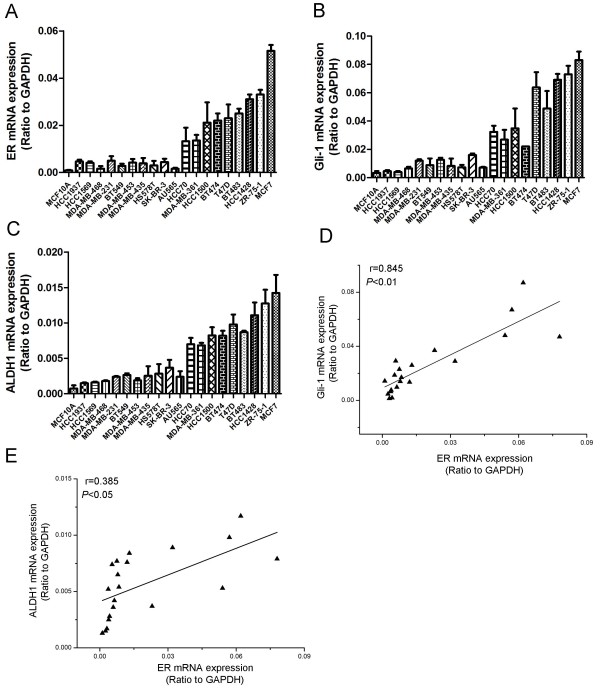
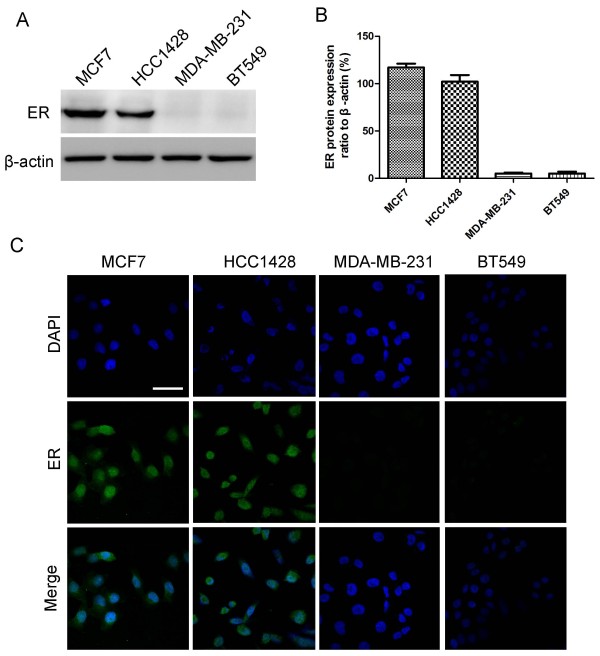
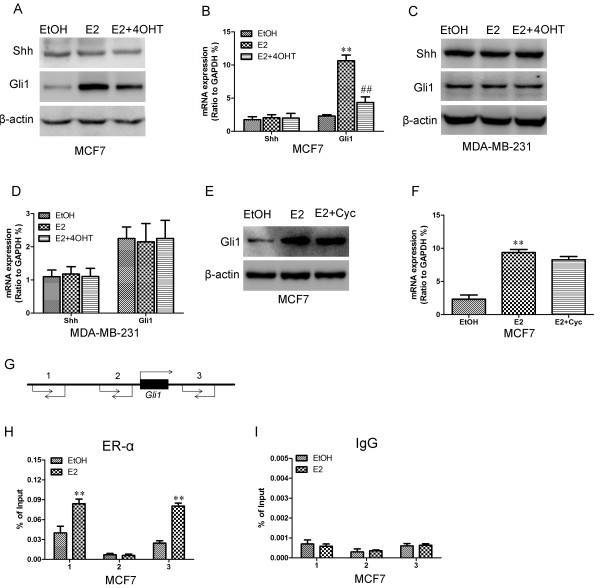
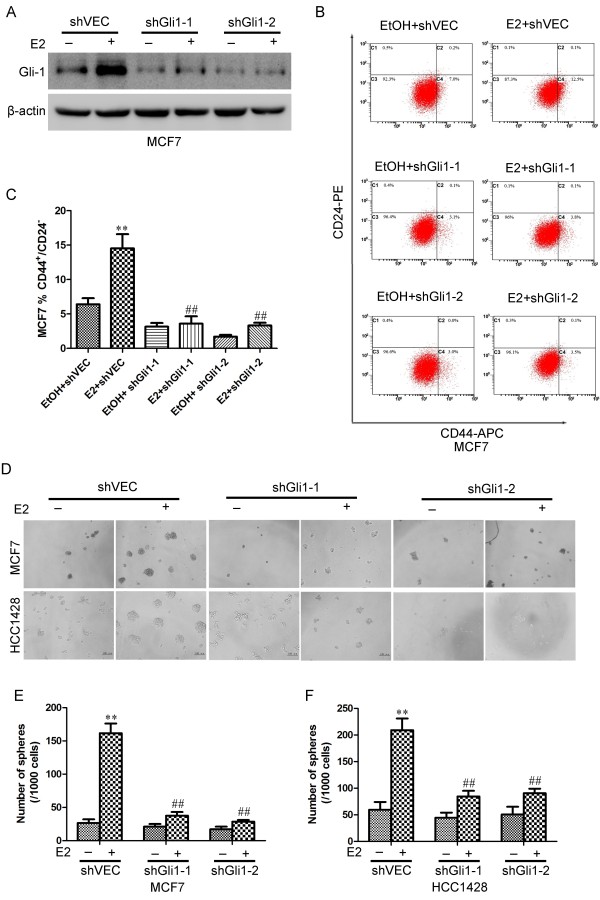
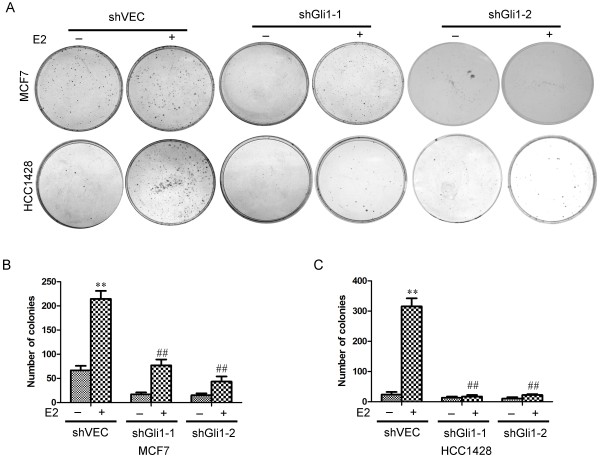
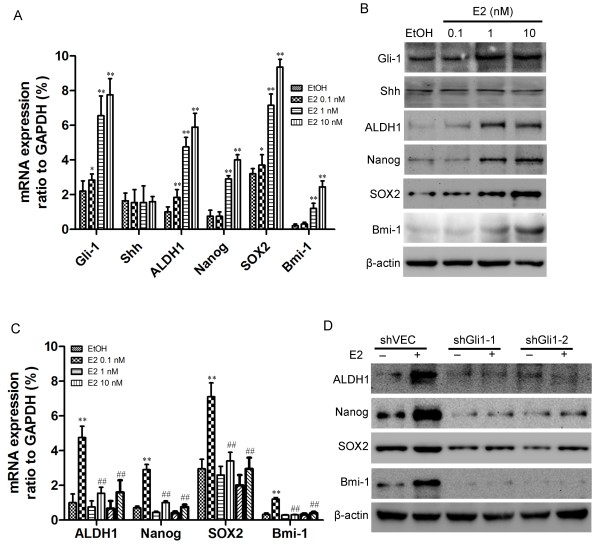
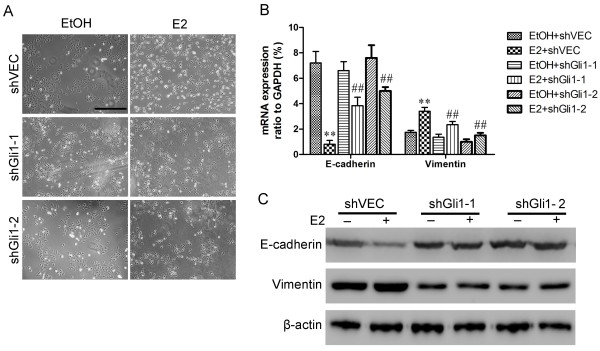
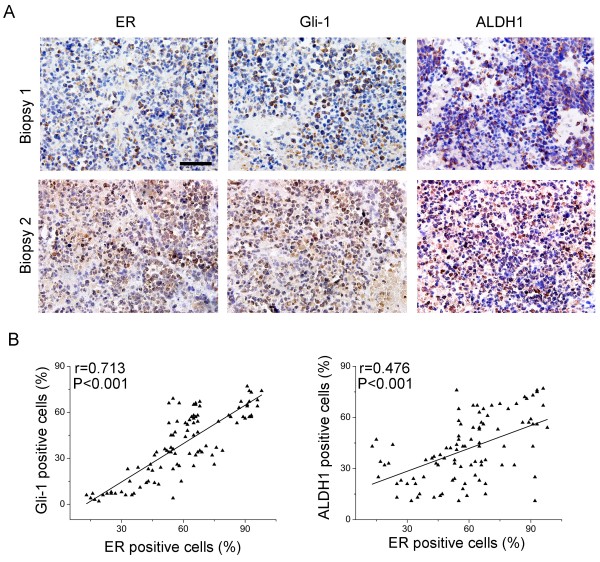
Results: Both mRNA and protein expressions of ER correlated with those of Gli1 and ALDH1. E2 induced Gli1 expression only in ER+ BC cells. E2 promoted CSC renewal, invasiveness and EMT in ER+/Gli1+ cells but not in Gli1-knockdown cells.

Conclusions: Our results indicate that estrogen acts via Gli1 to promote CSC development and EMT in ER+ BC cells. These findings also imply that Gli1 mediates cancer stem cells, and thus could be a target of a novel treatment for ER+ breast cancer.


Figures

Figure 1
Figure 1
Endogenous expression of ER, Gli1 and ALDH1 in human breast cancer cells lines. MRNA levels of (A)ER, (B)Gli1 and (C)ALDH1 were measured using real-time RT-PCR. (D & E) Linear correlation assays were used to analyze the relationship between ER and Gli1 (D) or ER and ALDH1 (E) expression levels.
Figure 2
Figure 2
ER expression in MCF-7, HCC1428, MDA-MB-231 and BT549 cells. (A) ER protein levels were analyzed using western blotting. β-Actin levels were measured as a loading control. (B) Histograms illustrate ER protein expression relative to that of β-actin. All data corresponded to the mean ± SD of three independent experiments. (C) Immunofluorescence staining of ER in MCF-7, HCC1428, MDA-MB-231 and BT549 cells. Green represents ER staining. Blue signals represent nuclear DNA staining with DAPI. Scale bars indicate 25 μm.
Figure 3
Figure 3
Estrogen promoted the expression of Gli1 through noncanonical Shh signaling in MCF-7 cell lines. (A & C) Western blotting was used to detect (A) Gli1 and Shh expression in MCF-7 or (C) MDA-MB-231 cells incubated with 10 nM estrogen (E2) with or without 1 μM 4-hydroxy tamoxifen (4OHT) for 4 days. β-Actin was used as a loading control. In (B) MCF-7 or (D) MDA-MB-231 cells, mRNA expression levels of Gli1 and Shh were measured using qRT-PCR, and expression was normalized to that of GAPDH. (E) Western blotting was used to detect Gli1 protein expression in E2 and/or cyclopamine-treated MCF7 cells. (F) RT-PCR was used to detect Gli1 mRNA expression in E2 and/or cyclopamine-treated MCF7 cells. (G) Schematic presentation of three regions relative to the Gli1 transcriptional start site used to design primers to test for ER-α occupied abundance. (H) QChIP was performed to assess ER-α occupancy in ETOH and E2-treated MCF7 cells. (I) IgG was used as negative control. “% of input” indicates the ratio of DNA fragment of each promoter region bound by ER-α to the total amount of input DNA fragment without ER-α antibody pull-down. All data correspond to the mean ± SD of three independent experiments. **, ## indicate significant differences from the control (p < 0.001).
Figure 4
Figure 4
Knockdown of Gli1 in ER-positive breast cancer cells inhibited estrogen induced sphere formation and CD44+/CD24-/low cells. (A) MCF-7 cells were transfected with control shRNA (shVEC) or shGli1 (shGli1-1 or shGli1-2) in the absence or presence of E2. Gli1 protein levels were analyzed using western blotting. β-Actin levels were measured as a loading control. (B) MCF-7 cells were treated with 10 nM E2 or ETOH as a control and transfected with shGli1-1, shGli1-2 or shVEC. After 4 days, cells were stained with anti-CD44-APC and anti-CD24-PE antibodies, and CD44+/CD24-/low subpopulations were examined using flow cytometry. (C) Histograms illustrate percentages of CD44+/CD24-/low subpopulations. (D) Representative images of MCF-7 and HCC1428 cells in the absence or presence of E2. MCF-7 and HCC1428 cells (1 cell/μL) were cultured in 96-well plates containing 100 μL SFM in each well with or without E2 for seven days. (E & F) The number of spheres was counted under a microscope. Error bars represent SEMs. **, ## indicate significant differences from the control (p < 0.001).
Figure 5
Figure 5
Estrogen increased the proliferation of ER-positive breast cancer cells. (A) Colony formation assays in MCF-7 and HCC1428 cells. MCF-7 and HCC1428 cells were transfected with vehicle control shRNA (shVEC), shGli1-1 or shGli1-2 in the absence or presence of E2. (B & C) The number of colonies was counted under a microscope. Error bars represent the SEM. **, ## indicate significant differences from the control (p < 0.001).
Figure 6
Figure 6
E2 enhanced the expression of CSC markers in ER-positive MCF-7 cells through Gli1. (A) MCF7 cells were treated with various concentrations (0.1, 1 or 10 nM) of E2 for 4 days. MRNA expression levels of Gli1, Shh, ALDH1, Nanog, SOX2 and Bmi-1 were measured using qRT-PCR, and expression was normalized to that of GAPDH. (B) Western blotting was used to determine the effects of various concentrations of E2 on the expression of Gli1, Shh, ALDH1, Nanog, SOX2 and Bmi-1 proteins in MCF-7 cells. β-Actin was used as a loading control. (C) MCF-7 cells were transfected with vehicle control shRNA (shVEC), shGli1-1 or shGli1-2 and grown in medium with ETOH or E2 for 4 days. RNAs were extracted and assayed using qRT-PCR to determine the expression levels of ALDH1, Nanog, SOX2 and Bmi-1 mRNAs. Bars represent the means ± SEs of three experiments (**, ##: P < 0.01). (D) Effects of E2 on the expression of ALDH1, Nanog, SOX2 and Bmi-1 were estimated using western blotting. β-Actin was used as a loading control.
Figure 7
Figure 7
E2 enhanced the invasiveness of MCF-7 cells via Gli1. (A) Representative images of wounds at 0 and 48 h in the presence of ETOH or E2. (B) Histograms illustrate relative wound widths at 0 and 48 h. The migration distance of each cell was measured after the photographs were converted to Photoshop files. (C) Matrigel invasion assay. MCF-7 cells were seeded into Matrigel-coated invasion chambers and were treated with ETOH (control) or E2 for 48 h. Representative images of stained invaded cells are shown. Magnification 100×. (D) The number of migrated cells was quantified by counting cells from 10 random fields. Data are representative of three independent experiments. Bars represent the means ± SEs of three experiments (**, ##: P < 0.01).
Figure 8
Figure 8
Knockdown of Gli1 inhibited estrogen-induced EMT in MCF-7 cells. (A) Estrogen induced morphological change from an epithelial to a fibroblast-like appearance in shVEC-transfected MCF-7 cells. Gli1-knockdown cells (shGli1-1 and shGli1-2) still maintained their epithelial morphologies seven days after treatment with E2. Scale bar,200 μm. ShVEC, shGli1-1 and shGli1-2-transfected MCF-7 cells were cultured in medium with 1% FBS in the presence ETOH or E2 for seven days. (B) Real-time qRT-PCR was used to determine the expression levels of E-cadherin and vimentin mRNAs. Bars represent the means ± SEs of three experiments (**, ##: P < 0.01). (C) Western blotting was used to determine the effects of shGli1 on the expression level of E-cadherin and vimentin proteins. β-Actin was used as a loading control.
Figure 9
Figure 9
The expression of ER correlated with the expression of EMT and stem cell-related markers in breast cancer tissue. (A) Expression levels of ER, Gli1 and ALDH1 were measured in a breast cancer tissue microarray using immunohistochemistry. Final magnification, 40×. Scale bar, 50 μm. (B) ER expression was significantly correlated with Gli1 and ALDH1 expression in breast cancer tissues. The coordinate axis equals the percentage of positive cells relative to the total number of cancer cells.

Similar articles

Cited by

References

    1. Kakarala M, Wicha MS. Implications of the cancer stem-cell hypothesis for breast cancer prevention and therapy. J Clin Oncol. 2008;26:2813–2820. doi: 10.1200/JCO.2008.16.3931. - DOI - PMC - PubMed
    1. O'Brien CA, Kreso A, Jamieson CH. Cancer stem cells and self-renewal. Clin Cancer Res. 2010;16:3113–3120. doi: 10.1158/1078-0432.CCR-09-2824. - DOI - PubMed
    1. Leis O, Eguiara A, Lopez-Arribillaga E, Alberdi MJ, Hernandez-Garcia S, Elorriaga K, Pandiella A, Rezola R, Martin AG. Sox2 expression in breast tumours and activation in breast cancer stem cells. Oncogene. 2012;31:1354–1365. doi: 10.1038/onc.2011.338. - DOI - PubMed
    1. Jeter CR, Liu B, Liu X, Chen X, Liu C, Calhoun-Davis T, Repass J, Zaehres H, Shen JJ, Tang DG. NANOG promotes cancer stem cell characteristics and prostate cancer resistance to androgen deprivation. Oncogene. 2011;30:3833–3845. doi: 10.1038/onc.2011.114. - DOI - PMC - PubMed
    1. Guo BH, Feng Y, Zhang R, Xu LH, Li MZ, Kung HF, Song LB, Zeng MS. Bmi-1 promotes invasion and metastasis, and its elevated expression is correlated with an advanced stage of breast cancer. Mol Cancer. 2011;10:10. doi: 10.1186/1476-4598-10-10. - DOI - PMC - PubMed

Publication types

MeSH terms

Substances