. 2014 Oct;62(10):1582-94.
doi: 10.1002/glia.22701. Epub 2014 Jun 3.

Glial cells suppress postencephalitic CD8+ T lymphocytes through PD-L1

Affiliations

Glial cells suppress postencephalitic CD8+ T lymphocytes through PD-L1

Scott J Schachtele et al. Glia. 2014 Oct.

Abstract

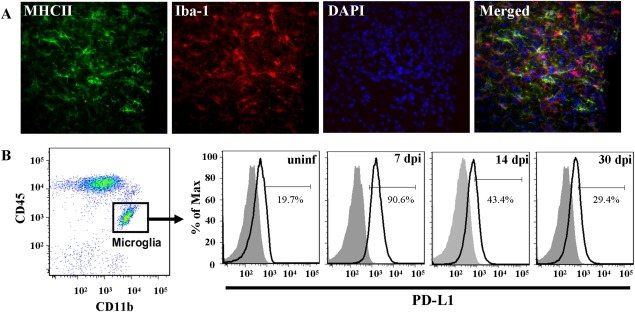
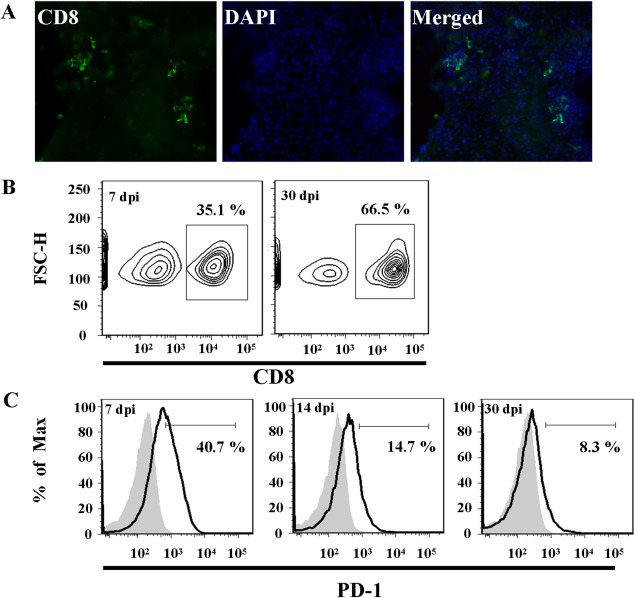
Engagement of the programmed death (PD)-1 receptor on activated cells by its ligand (PD-L1) is a mechanism for suppression of activated T-lymphocytes. Microglia, the resident inflammatory cells of the brain, are important for pathogen detection and initiation of innate immunity, however, a novel role for these cells as immune regulators has also emerged. PD-L1 on microglia has been shown to negatively regulate T-cell activation in models of multiple sclerosis and acute viral encephalitis. In this study, we investigated the role of glial cell PD-L1 in controlling encephalitogenic CD8(+) T-lymphocytes, which infiltrate the brain to manage viral infection, but remain to produce chronic neuroinflammation. Using a model of chronic neuroinflammation following murine cytomegalovirus (MCMV)-induced encephalitis, we found that CD8(+) T-cells persisting within the brain expressed PD-1. Conversely, activated microglia expressed PD-L1. In vitro, primary murine microglia, which express low basal levels of PD-L1, upregulated the co-inhibitory ligand on IFN-γ-treatment. Blockade of the PD-1: PD-L1 pathway in microglial: CD8(+) T-cell co-cultures increased T-cell IFN-γ and interleukin (IL)-2 production. We observed a similar phenomenon following blockade of this co-inhibitory pathway in astrocyte: CD8(+) T-cell co-cultures. Using ex vivo cultures of brain leukocytes, including microglia and CD8(+) T-cells, obtained from mice with MCMV-induced chronic neuroinflammation, we found that neutralization of either PD-1 or PD-L1 increased IFN-γ production from virus-specific CD8(+) T-cells stimulated with MCMV IE1168-176 peptide. These data demonstrate that microglia and astrocytes control antiviral T-cell responses and suggest a therapeutic potential of PD1: PD-L1 modulation to manage the deleterious consequences of uncontrolled neuroinflammation.

Keywords: astrocyte; encephalitis; immune suppression; major histocompatibility complex Class II; microglia; neuroinflammation.


Figures

Figure 1
Figure 1
Microglia chronically express MHC Class II and PD‐L1 following MCMV‐induced encephalitis. MCMV‐infected Balb/c mice were perfused (30 dpi) and cryosectioned for immunohistochemistry. (A) Co‐labeling of MHC II (green), as an indicator of activation, and the microglial cell marker, Iba‐1 (red). Nuclear counterstain with DAPI (blue). Tissue section thickness = 25 µm. (B) Mononuclear cells were extracted from uninfected and MCMV‐infected Balb/c mouse brains (7, 14, and 30 dpi). Cells were analyzed for surface expression of PD‐L1 on microglia using flow cytometry. Microglia were identified as CD45intCD11b+ and were specifically gated on for PD‐L1 (black line). Isotype antibody control = filled grey line. Flow plots are representative of three separate experiments.
Figure 2
Figure 2
CD8+ T‐cells persist and express PD‐1 in the postencephalitic murine brain. (A) Immunohistochemical detection of CD8+ T‐cells (green) in the parenchyma and surrounding the lateral ventricles in MCMV‐infected mice at 30 dpi. (B, C) Mononuclear cells were extracted from MCMV‐infected Balb/c brains and brain infiltrating T‐cells were identified by flow cytometry as CD45+CD11blow. (B) CD45+CD11blow cells were gated on to analyze the CD8+ cell population in the brains of MCMV‐infected mice at 7 and 30 dpi. (C) PD‐1 surface expression on CD8+ T‐cells at 7, 14, and 30 dpi (black line). Isotype antibody control = filled gray line. Flow plots are representative of three separate experiments.
Figure 3
Figure 3
Proinflammatory cytokines induce PD‐L1 expression in primary cultured murine microglia. Primary purified microglia cultures (1–2 × 10⁵ cells/well) were left untreated or stimulated with IFN‐γ (200 units/mL), TNFα (20 ng/mL) or IL‐β (10 ng/mL). (A) PD‐L1 expression was determined by semiquantitative RT‐PCR of microglial mRNA. (B, C) Flow cytometric detection of surface PD‐L1 (B), MHC II (C), and MHC I (D) on control and IFN‐γ‐stimulated (24 h) microglia. Isotype antibody control = filled gray line. RT‐PCR and flow cytometry graphs are representative of three separate experiments.
Figure 4
Figure 4
Microglia suppress activated CD8+ T‐cells through PD‐1: PD‐L1. (A) CD8+ T‐cells from uninfected Balb/c mice were placed into culture (2 × 10⁵ cells/well) wells coated with α‐CD3 Abs (2 µg/mL). Cells were collected and analyzed at 0, 24, and 48 h for PD‐1 receptor surface expression. Isotype = filled gray line. (B, C) Unstimulated CD8 T‐cells (untreated) or CD3‐stimulated CD8+ T‐cells were transferred into co‐culture with microglia that received an IFN‐γ (200 Units/mL) pretreatment for 8 h. CD8+ T‐cells were added at a 10:1 CD8: Glial cell ratio. Prior to CD8+ T‐cell addition, co‐cultures were left untreated (control) or treated for 2 h with α‐PD‐L1, α‐PD‐L2, or α‐PD‐1 neutralizing antibody. Treatment with rat IgG2a was used as an isotype antibody control. Supernatants were collected at 24 h and ELISA run for IFN‐γ (B) and IL‐2 (C). Histograms are representative of three separate experiments. *P ≤ 0.01. **P ≤ 0.001.
Figure 5
Figure 5
PD‐1: PD‐L1 pathway inhibits CD8+ T‐cell IFN‐γ and IL‐2 expression in the postencephalitic brain. Mononuclear cells were isolated from the brains of MCMV‐infected Balb/c mice at 14 dpi (n = 5/group) and cultured (1.3 × 10⁵ cells/well) in the presence of 0, 5, or 50 µM CD8‐specific MCMV‐ IE1168–176 peptide. Prior to the addition of peptide the cultures were treated with PD‐L1 neutralizing antibody (α‐PD‐L1; gray bars), control rat IgG isotype (IgG2a; white bars) or left untreated (black bars). Supernatants were collected after 48 h in culture with peptide and analyzed for IFN‐γ (A) and IL‐2 (B) levels (pg/mL). Data are representative of three separate experiments. **P ≤ 0.001.
Figure 6
Figure 6
Activated astrocytes express PD‐L1, MHC I, and MHC II. (A) In vivo expression of MHC Class II on astrocytes following MCMV infection of Balb/c mice (30 dpi). GFAP‐positive (red) astrocytes co‐label with MHC Class II (green). Nuclei were stained with DAPI (blue). Tissue section thickness = 25 µm. (B–E) Purified astrocyte cultures (2–3 × 10⁵ cells/well) were left untouched (control) or stimulated with IFN‐γ for 24–48 h. (B) FSC‐A/SSC‐A dot plot shows the gating strategy for flow cytometric analysis of a single cell suspension of cultured astrocytes. (C, D) Flow cytometry of MHC Class II (C) and PD‐L1 (D) surface expression on astrocytes following 24 h stimulation with IFN‐γ. (E) RT‐PCR mRNA expression of PD‐L1 in astrocytes after 24 and 48 h IFN‐γ stimulation. (F) Flow cytometric analysis of MHC Class I expression on astrocytes following IFN‐γ treatment (24 h). Expression values are normalized to unstimulated controls at each time point. RT‐PCR and flow cytometry graphs are representative of three separate experiments.
Figure 7
Figure 7
Astrocytes inhibit CD8+ T‐cell cytokine production through PD‐1: PDL‐1. (A, B) CD8+ T‐cells were either untouched (untreated) or stimulated with anti‐CD3 Abs for 1 h prior to transfer into co‐culture with purified astrocytes (anti‐CD3 stimulated CD8 cells). Astrocyte cultures were pretreated for 8 h with IFN‐γ (200 U/mL) to stimulated PD‐L1 expression. CD8+ T‐cells were added at a 10:1 CD8: Glial cell ratio. Prior to CD8+ T‐cell addition, astrocyte cultures were left untreated (control) or treated for 2 h with α‐PD‐L1, α‐PD‐L2, or α‐PD‐1 neutralizing antibody. Treatment with rat IgG2a was used as an isotype antibody control. Supernatants were collected at 24 h and ELISA run for IFN‐γ (A) and IL‐2 (B). Histograms are representative of three separate experiments. *P ≤ 0.01, **P ≤ 0.001.

References

    1. Aloisi F. 2001. Immune function of microglia. Glia 36:165–179. - PubMed
    1. Armien AG, Hu S, Little MR, Robinson N, Lokensgard JR, Low WC, Cheeran MC. 2010. Chronic cortical and subcortical pathology with associated neurological deficits ensuing experimental herpes encephalitis. Brain Pathol 20:738–750. - PMC - PubMed
    1. Blais V, Rivest S. 2004. Effects of TNF‐alpha and IFN‐gamma on nitric oxide‐induced neurotoxicity in the mouse brain. J Immunol 172:7043–7052. - PubMed
    1. Carter LL, Leach MW, Azoitei ML, Cui J, Pelker JW, Jussif J, Benoit S, Ireland G, Luxenberg D, Askew GR, KL Milarski, C Groves, T Brown, BA Carito, K Percival, BM Carreno, M Collins, S Marusic. 2007. PD‐1/PD‐L1, but not PD‐1/PD‐L2, interactions regulate the severity of experimental autoimmune encephalomyelitis. J Neuroimmunol 182:124–134. - PubMed
    1. Cheeran MC, Gekker G, Hu S, Min X, Cox D, Lokensgard JR. 2004. Intracerebral infection with murine cytomegalovirus induces CXCL10 and is restricted by adoptive transfer of splenocytes. J Neurovirol 10:152–162. - PubMed

Publication types

MeSH terms