. 2014 Jun;92(2):351-94.
doi: 10.1111/1468-0009.12061.

How successful is Medicare Advantage?

Affiliations

How successful is Medicare Advantage?

Joseph P Newhouse et al. Milbank Q. 2014 Jun.

Abstract

Context: Medicare Part C, or Medicare Advantage (MA), now almost 30 years old, has generally been viewed as a policy disappointment. Enrollment has vacillated but has never come close to the penetration of managed care plans in the commercial insurance market or in Medicaid, and because of payment policy decisions and selection, the MA program is viewed as having added to cost rather than saving funds for the Medicare program. Recent changes in Medicare policy, including improved risk adjustment, however, may have changed this picture.

Methods: This article summarizes findings from our group's work evaluating MA's recent performance and investigating payment options for improving its performance even more. We studied the behavior of both beneficiaries and plans, as well as the effects of Medicare policy.

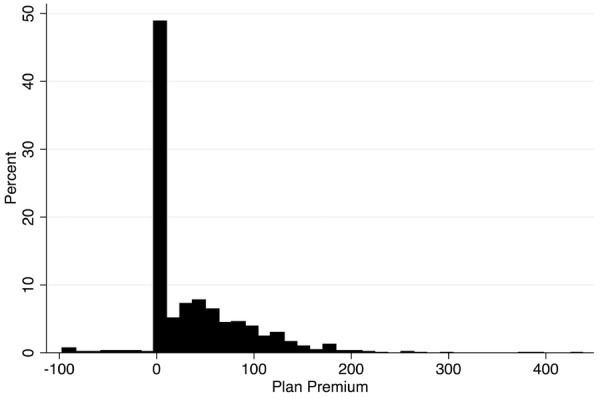
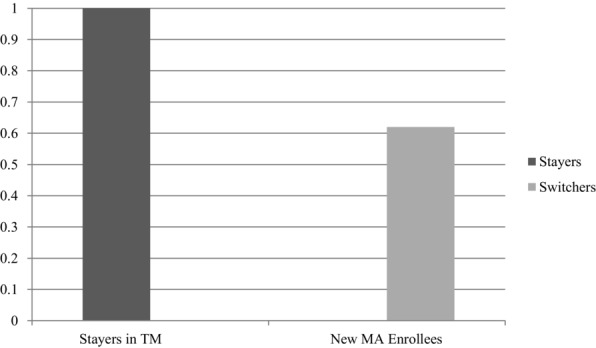
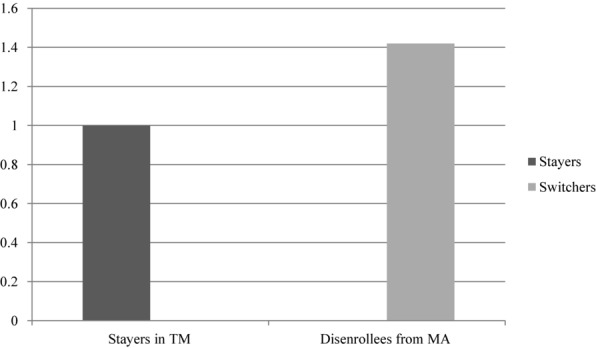
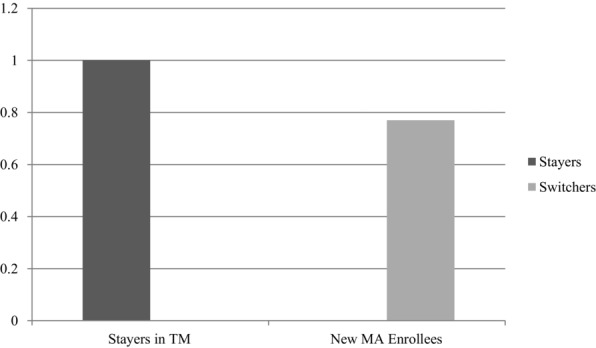
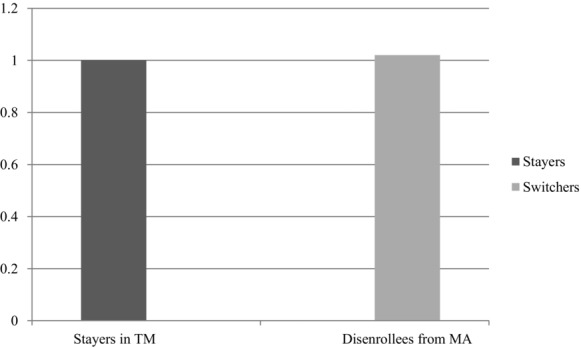
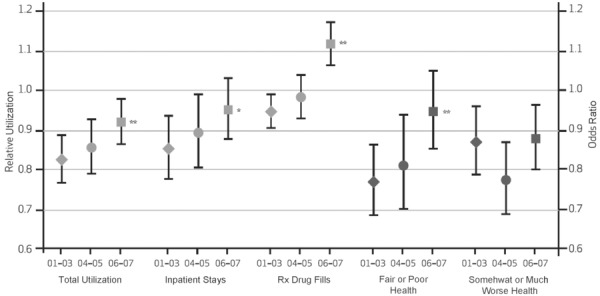
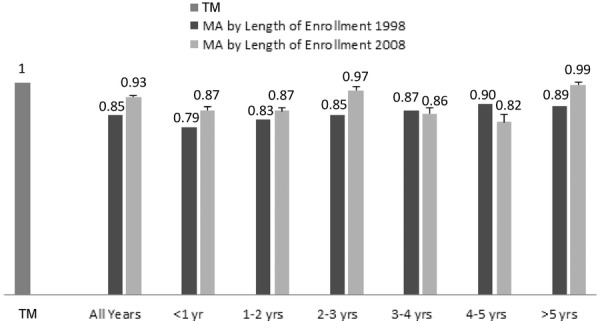
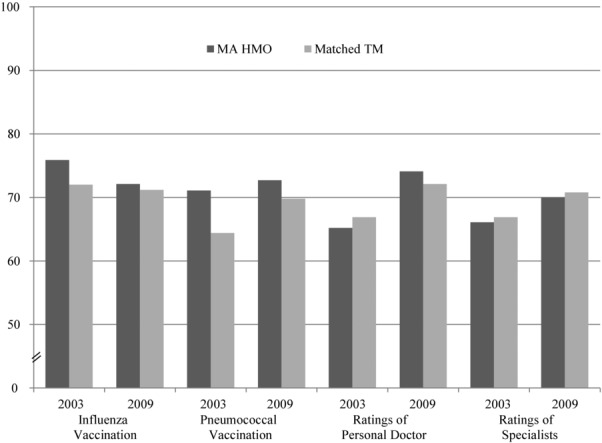
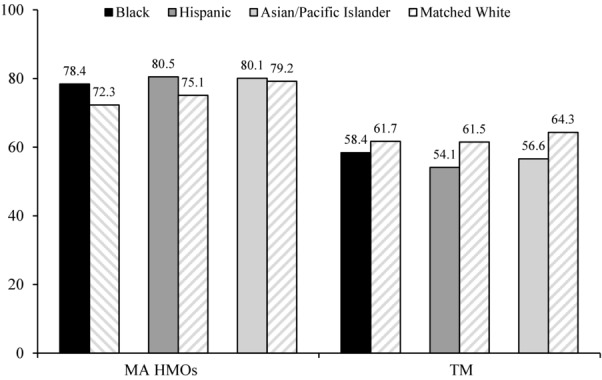
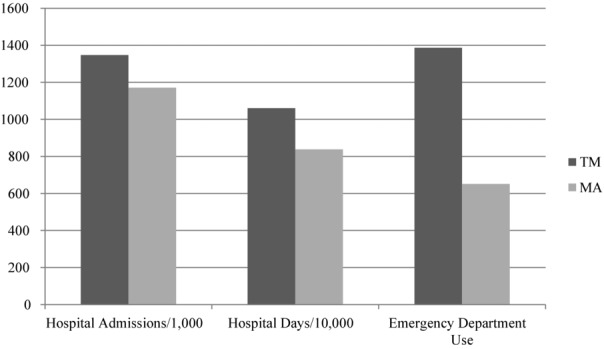
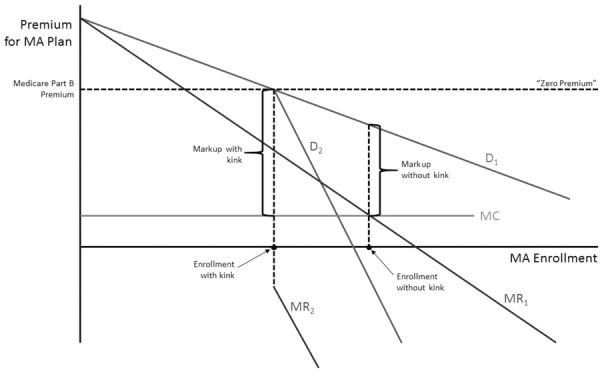
Findings: Beneficiaries make "mistakes" in their choice of MA plan options that can be explained by behavioral economics. Few beneficiaries make an active choice after they enroll in Medicare. The high prevalence of "zero-premium" plans signals inefficiency in plan design and in the market's functioning. That is, Medicare premium policies interfere with economically efficient choices. The adverse selection problem, in which healthier, lower-cost beneficiaries tend to join MA, appears much diminished. The available measures, while limited, suggest that, on average, MA plans offer care of equal or higher quality and for less cost than traditional Medicare (TM). In counties, greater MA penetration appears to improve TM's performance.

Conclusions: Medicare policies regarding lock-in provisions and risk adjustment that were adopted in the mid-2000s have mitigated the adverse selection problem previously plaguing MA. On average, MA plans appear to offer higher value than TM, and positive spillovers from MA into TM imply that reimbursement should not necessarily be neutral. Policy changes in Medicare that reform the way that beneficiaries are charged for MA plan membership are warranted to move more beneficiaries into MA.

Keywords: Medicare; health care costs; managed care; payment policy.


Figures

Figure 1
Figure 1
Weighted Distribution of MA Plan Premiums in 2010 Data derived from the 2010 CMS Medicare Options Compare database, subsetted to local, nonemployer, non-special needs plans.
Figure 2
Figure 2
Evidence of Selection 1989-1994: Prior Medicare Spending of Those Switching to MA Compared with Those Remaining in TM Values are based on 1989-1994 data and show spending by new MA enrollees in the 6 months before they joined MA (when they were in TM), compared with TM enrollees matched for age, sex, welfare status, employment status, and county. Stayers were randomly given a pseudodate of enrollment to match the new MA cohort's distribution of enrollment dates.
Figure 3
Figure 3
Evidence of Selection 1989-1994: Subsequent Medicare Spending of Those Switching to TM Compared with Those Remaining in TM Values are based on 1989-1994 data and show spending by MA disenrollees in the 6 months after they left MA (when they were in TM), compared with TM enrollees matched for age, sex, welfare status, employment status, and county. Stayers were randomly given a pseudodate of disenrollment to match the actual disenrollees’ distribution of disenrollment dates.
Figure 4
Figure 4
Evidence of Selection 1997: Prior Medicare Spending of Those Switching to MA Compared with Those Remaining in TM Values are based on 1997 data and show spending by new MA enrollees in the 12 months before they joined MA (when they were in TM), compared with TM enrollees matched for age, sex, welfare status, employment status, and county. Stayers were randomly given a pseudodate of enrollment to match the distribution dates of the new MA cohort's enrollment.
Figure 5
Figure 5
Evidence of Little Selection 1997: Subsequent Medicare Spending of Those Switching to TM Compared with Those Remaining in TM Values are based on 1997 data and show spending by MA disenrollees in the 12 months after they left MA (when they were in TM), compared with TM enrollees matched for age, sex, welfare status, employment status, and county. Stayers were randomly given a pseudodate of disenrollment to match the distribution of the disenrollees’ disenrollment dates. The result shown, minimal selection, is much different from that in Figure 3, in part because of differences in methods and perhaps because the data come from a later year. The differences in methods are the following: (1) The data show the spending in 1998 of all disenrollees during 1997 versus the spending by those who did not disenroll. This meant that a person had to survive until January 1998 to be included (death was not counted as disenrollment for this purpose). In particular, if those near death in 1997 left MA and then died before January 1998, they were not included in this sample, but they were included in the 1989-1994 sample shown in Figure 3. MedPAC, however, made an adjustment for this. (2) Those persons in the 1989-1994 sample had to have been enrolled in MA for 3 months. (3) These values use 12 months of postenrollment spending, and Figure 3 uses 6 months. The adjustment for bias from deaths in the MedPAC study was as follows: The “treatment” group was made up of all TM members who enrolled in or disenrolled from MA in year t. To be included, they had to survive until the beginning of year t because the TM comparison group was enrolled in TM in both year t-1 and year t. To correct for possible bias, MedPAC calculated the distribution of enrollment in (and disenrollment from) MA by month for 1997. For example, 80% of the calendar year's enrollment may take place in January, 5% in February, etc. The researchers then randomly assigned the TM comparison group to a pseudomonth of enrollment (or disenrollment) based on these percentages. Finally, they dropped from the comparison group any persons who died before the pseudomonth of enrollment (or disenrollment).
Figure 6
Figure 6
Differences in Utilization and Self-Reported Health Between All MA and All TM Enrollees, 2001-2003, 2004-2005, and 2006-2007 Reproduced with permission from Health Affairs. For each measure of utilization and of health, the differences between all participants enrolled in MA (continuously enrolled or switched into MA within calendar years) and all participants enrolled in TM (continuously enrolled or switched into TM during the calendar year) are plotted by period (2001-2003, 2004-2005, and 2006-2007) with 95% confidence intervals. Estimates of relative utilization (RU) and odds ratios (OR) are presented for comparisons of utilization and health indicators, respectively, with TM beneficiaries serving as the reference group. Statistically significant changes in group differences from 2001-2003 to 2006-2007 are noted at p < 0.10(*) and p < 0.05(**) levels.
Figure 7
Figure 7
MA Mortality/TM Mortality, by Length of Enrollment in MA, 1998, 2008 Reproduced with permission from Health Affairs. Rates are adjusted for age, gender, and Medicaid status. For the TM group, anyone who was in MA at any point in 2003-2008 was excluded, and for the MA group, anyone who switched to TM in 2008 was excluded, except for MA enrollees who elected hospice in 2008 and were shown as in TM after that election (this group comprised 2% of MA enrollees who elected hospice). If the latter group is excluded, the 2008 rate for all years would drop to 0.92, the less-than-1-year rate to 0.85, and the more-than-5-year rate to 0.98. The bars above the 2008 rates are the upper limit of a 95% confidence interval. MedPAC did not compute confidence intervals for the 1998 mortality results, so we could not test formally for differences, but Part C enrollment in 1998 was 6 million versus 9.9 million in 2008. TM enrollment was slightly smaller than in 2008. Adjusting for the difference in sample size and the drop in the elderly's mortality rates between 1998 and 2008, confidence intervals in 1998 are about 30% larger than in 2008. Using this value, the mortality differences between 1998 and 2008 for all Part C enrollees, as well as for almost all the other differences shown, are significant at standard levels of significance.
Figure 8
Figure 8
Margins by HCC or a Combination of HCCs (minus a constant) Adapted from the Journal of Health Economics. The values of the margins are average reimbursement in MA for that diagnosis or combination of diagnoses divided by the average cost in MA for a single plan less a constant to preserve confidentiality. The average reimbursement in MA is approximately proportional to the average cost in TM, so those HCCs or combinations of HCCs to the left in the figure are those for which the ratio of the cost in MA to the cost in TM to treat the condition is larger than those HCCs to the right.
Figure 9
Figure 9
Quality of Care as Assessed by HEDIS Measures for MA HMOs Matched to TM Beneficiaries in 2003 or 2006 and 2009 (% receiving) Reproduced with permission from Health Affairs. HMO and TM enrollees were matched by age, sex, and race/ethnicity in local areas and weighted by MA HMO plan enrollment to derive national estimates. All differences between MA HMOs and TM were statistically significant (p < 0.001) for each measure in each study year. For LDL cholesterol testing, the measure specifications changed in 2006, so the figures for earlier years are not presented.
Figure 10
Figure 10
Quality of Care on CAHPS Measures for MA HMOs Matched to TM Beneficiaries in 2003 and 2009 (% receiving or beneficiary ratings on 0-100 scale) Reproduced with permission from Health Affairs. HMO and TM enrollees in counties were matched by age, sex, and race/ethnicity self-reported health status and were weighted by enrollment in MA HMO plans to derive national estimates with 2-tailed p values for each measure by study year. CAHPS measures were not collected for MA HMO enrollees in 2006 or for TM enrollees in 2005 or 2006, and response rates were relatively low for both groups in 2007. For ratings of personal doctor and specialists, proportions represent ratings of 9 or 10 on a 0-10 scale. Two-sided p-values are shown.
Figure 11
Figure 11
Use of Mammography by Race/Ethnicity Among Women Ages 65-69 in MA HMOs and TM (values are % of users) Adapted from the Journal of the National Cancer Institute.
Figure 12
Figure 12
Hospital Admissions, Hospital Days, and Emergency Department Use Among Decedents in the Last 6 Months of Life, TM and MA, 2009 Adapted from Medical Care.
Figure 13
Figure 13
The “Kinked Demand Curve” for MA Explains Prevalence of “Zero-Premium Plans,” Inhibits Enrollment, and Reinforces Market Power

References

    1. McGuire TG, Newhouse JP, Sinaiko AD. A history of Medicare Part C. Milbank Q. 2011;89(2):289–332. - PMC - PubMed
    1. Gold M, Jacobson G, D'Amico A, Neuman T. Medicare Advantage 2013 spotlight: enrollment market update http://kaiserfamilyfoundation.files.wordpress.com/2013/06/8448.pdf. Published June 2013. Accessed September 7, 2013.
    1. Centers for Medicare and Medicaid Services. CMS fast facts http://www.cms.gov/Research-Statistics-Data-and-Systems/Statistics-Trend.... Updated January 15, 2014. Accessed February 5, 2014. - PubMed
    1. Eggers P. Risk differential between Medicare beneficiaries enrolled and not enrolled in an HMO. Health Care Finance Rev. 1980;1(3):91–99. - PMC - PubMed
    1. Eggers P, Prihoda R. Pre-enrollment reimbursement patterns of Medicare beneficiaries enrolled in “at-risk” HMOs. Health Care Finance Rev. 1982;4(1):55–73. - PMC - PubMed

Publication types

MeSH terms

LinkOut - more resources