. 2014 Jun 2;16(3):R57.
doi: 10.1186/bcr3668.

An integrated genomic approach identifies persistent tumor suppressive effects of transforming growth factor-β in human breast cancer

An integrated genomic approach identifies persistent tumor suppressive effects of transforming growth factor-β in human breast cancer

Misako Sato et al. Breast Cancer Res. .

Abstract

Introduction: Transforming growth factor-βs (TGF-βs) play a dual role in breast cancer, with context-dependent tumor-suppressive or pro-oncogenic effects. TGF-β antagonists are showing promise in early-phase clinical oncology trials to neutralize the pro-oncogenic effects. However, there is currently no way to determine whether the tumor-suppressive effects of TGF-β are still active in human breast tumors at the time of surgery and treatment, a situation that could lead to adverse therapeutic responses.

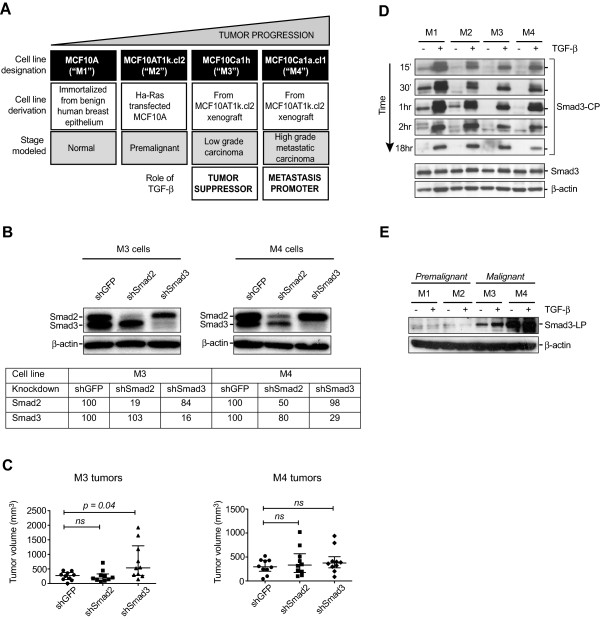
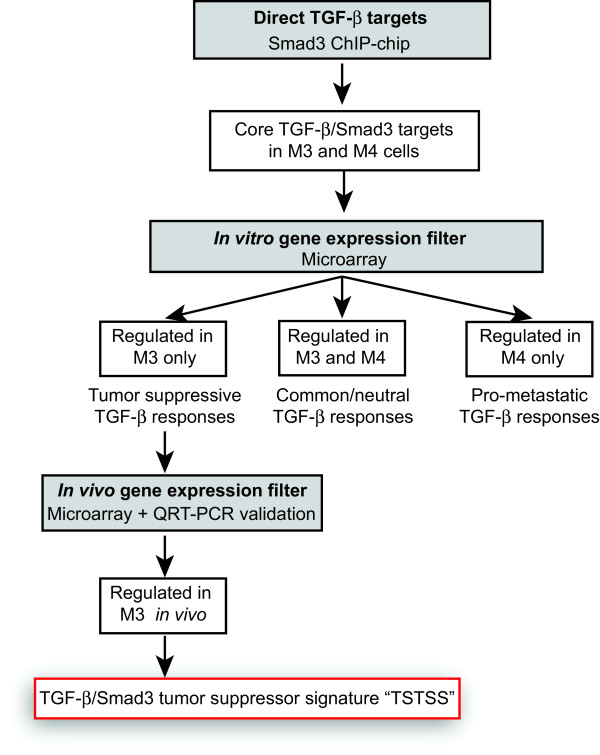
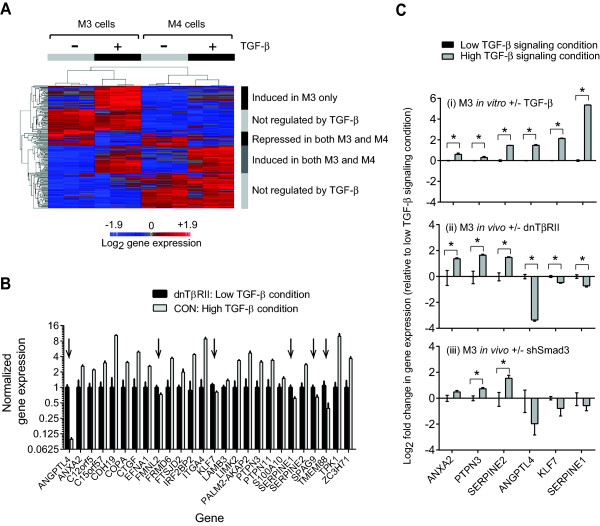
Methods: Using a breast cancer progression model that exemplifies the dual role of TGF-β, promoter-wide chromatin immunoprecipitation and transcriptomic approaches were applied to identify a core set of TGF-β-regulated genes that specifically reflect only the tumor-suppressor arm of the pathway. The clinical significance of this signature and the underlying biology were investigated using bioinformatic analyses in clinical breast cancer datasets, and knockdown validation approaches in tumor xenografts.

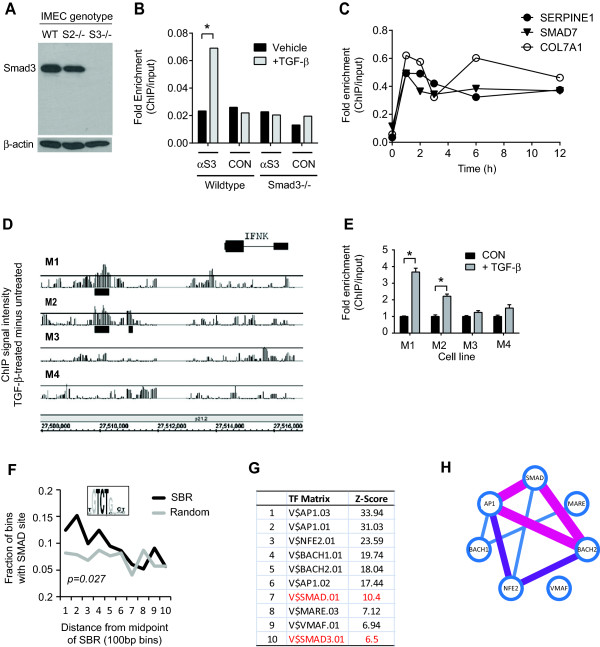
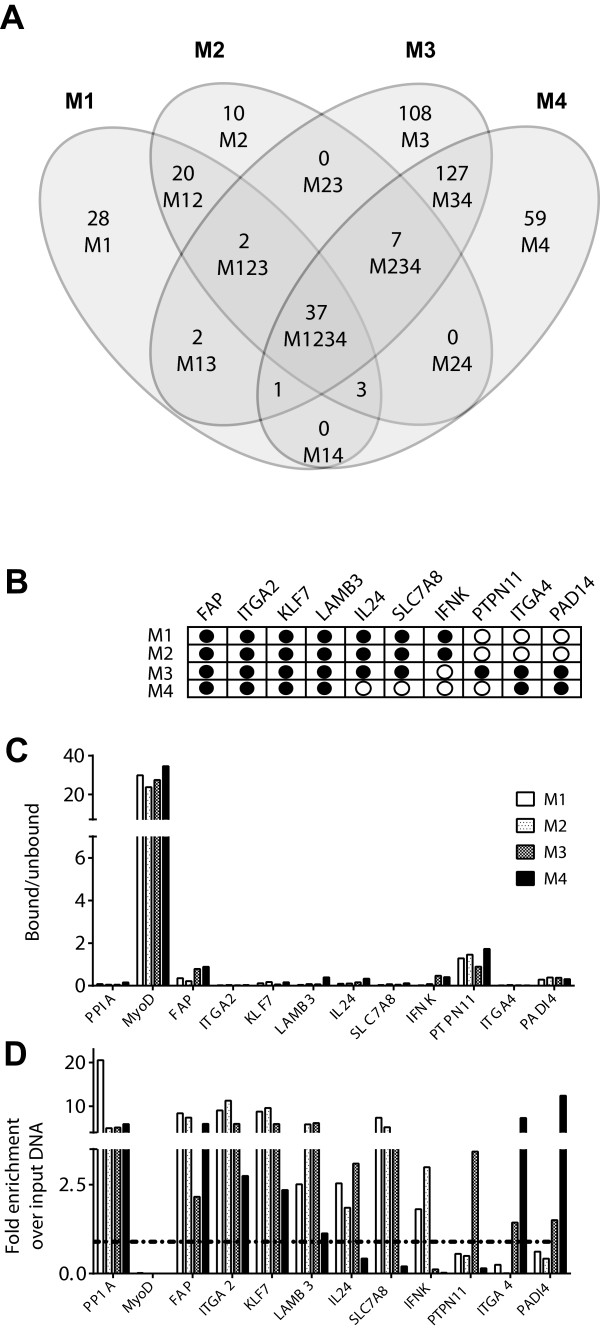
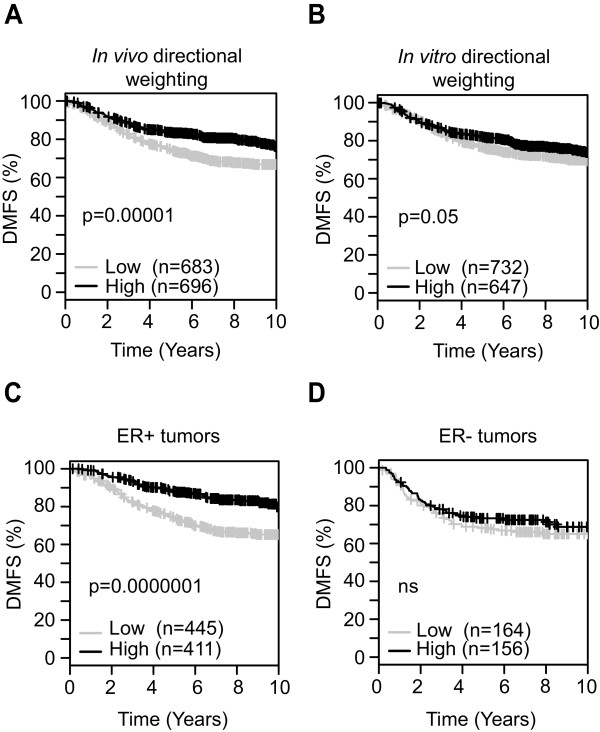
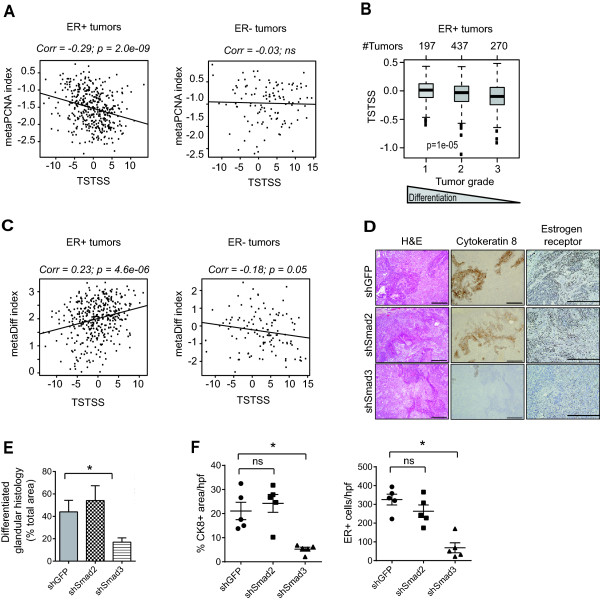
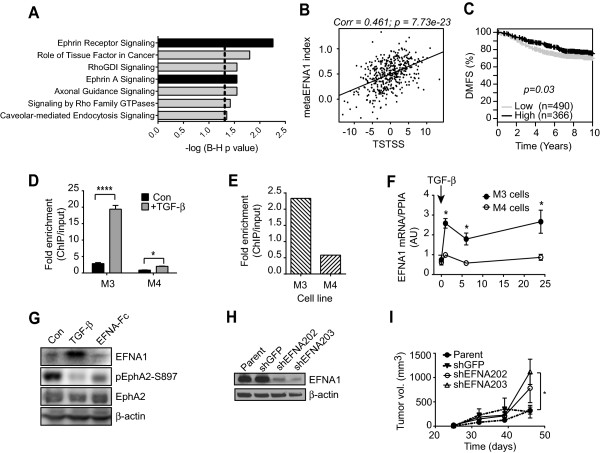
Results: TGF-β-driven tumor suppression was highly dependent on Smad3, and Smad3 target genes that were specifically enriched for involvement in tumor suppression were identified. Patterns of Smad3 binding reflected the preexisting active chromatin landscape, and target genes were frequently regulated in opposite directions in vitro and in vivo, highlighting the strong contextuality of TGF-β action. An in vivo-weighted TGF-β/Smad3 tumor-suppressor signature was associated with good outcome in estrogen receptor-positive breast cancer cohorts. TGF-β/Smad3 effects on cell proliferation, differentiation and ephrin signaling contributed to the observed tumor suppression.

Conclusions: Tumor-suppressive effects of TGF-β persist in some breast cancer patients at the time of surgery and affect clinical outcome. Carefully tailored in vitro/in vivo genomic approaches can identify such patients for exclusion from treatment with TGF-β antagonists.

Trial registration: ClinicalTrials.gov NCT01401062.


Figures

Figure 1
Figure 1
Smad3 mediates tumor suppression by TGF-β in the MCF10A model of breast cancer progression. (A) Schematic illustration of the MCF10A-based xenograft model of breast cancer progression. TGF-β has tumor-suppressor activity in M3 cells but this effect is lost in M4 cells and instead TGF-β promotes metastasis. (B) Knockdown of Smad2 and Smad3 protein in M3 and M4 cells was verified by Western blot, quantitated relative to the β-actin loading control and normalized relative to the shGFP condition for each cell line. (C) Relative contributions of Smad2 and Smad3 to the tumor-suppressive effect of TGF-β. Mice were orthotopically implanted with M3 cells or M4 cells, genetically modified to stably express shSmad2, shSmad3 or the control shGFP, and tumor volumes were assessed after seven weeks (M3) or four weeks (M4). Bars indicate median +/−interquartile range; P <0.05 was statistically significant, Mann-Whitney U test. ns, not significant. (D) Kinetics of Smad3 phosphorylation. Western blot of total Smad3 protein and C-terminal phosphorylated Smad3 (Smad3-CP) levels at various time points after TGF-β treatment in M1 to 4 cells. Total Smad3 is shown for t = 0 h. (E) Western blot showing linker phosphorylated Smad3 (Smad3-LP) at 1 hour after treatment with 2 ng/ml TGF-β. TGF-β, transforming growth factor beta.
Figure 2
Figure 2
Identification of Smad3 target genes by ChIP-chip in the MCF10A progression series. (A) The anti-Smad3 antibody recognizes a unique band in wild type and Smad2 null but not Smad3 null IMECs by Western blot. (B) ChIP-QPCR showing ability of Smad3 antibody (αS3) to immunoprecipitate Smad3 bound to the Smad7 promoter in Smad3 wild-type but not Smad3 knockout mouse embryo fibroblasts. CON, isotype-matched control antibody. (C) Time course of Smad3 occupancy at promoters of three previously characterized Smad3 target genes assessed by ChIP-QPCR following treatment of M3 cells with TGF-β. (D) Genome browser view (hg18) of Smad3 binding in the promoter of IFNK in M1 to M4 cells. The signal represents the difference between the TGF-β-treated and untreated conditions. The threshold represents signal intensity corresponding to FDR = 0.15. Black rectangles represent regions of significant Smad3 binding. (E) ChIP-QPCR validation of Smad3 occupancy at the IFNK locus. Results are mean +/−SD (n = 3) normalized to no TGF-β condition. *P <0.05 for enrichment >2-fold. (F) Enrichment of the canonical Smad binding element (SBE) in SBRs. The black line represents 190 high confidence SBRs and the grey line represents 190 random promoter regions with no Smad3 binding. The generic SMAD binding motif is shown. (G) Top 10 enriched transcription factor (TF) matrices within +/−250 bp of the center of 190 high confidence SBRs. (H) Schematic showing co-occurrence for the most enriched TF motifs. Pairwise analysis of each enriched motif was performed using the Fisher’s exact test with Bonferroni correction. The adjusted P values for co-occurrence of pairs of TFs are represented by the connecting lines: P <1e-7 (purple), P <1e-5 (pink), P <1e-2 (black). ChIP, chromatin immunoprecipitation; FDR, false discovery rate; IMEC, immortalized mouse mammary epithelial cells; QPCR, quantitative polymerase chain reaction; SBR, Smad binding region; TGF-β, transforming growth factor beta.
Figure 3
Figure 3
Smad3 binding differs widely across the progression series. (A) Petal plot showing the overlap in Smad3 target genes between the different cell lines. The genes involved are given in Supporting Information Table S1 in Additional file 4. (B) Representative genes with distinct Smad3 occupancy patterns as confirmed by ChIP-QPCR. Closed circles indicate TGF-β-induced Smad3 occupancy. (C) DNA methylation status at promoter regions of each target gene in (B) as determined by MeDIP-QPCR. Relative enrichment in the bound (MeDIP) vs. unbound fractions is shown. PPIA and MyoD were controls for unmethylated and highly methylated DNAs respectively. (D) QPCR quantitation of target enrichment following ChIP using anti-H3AcK9/14 to identify active chromatin. Enrichment at the SBR was calculated relative to input DNA. PPIA and MyoD were controls for active and inactive promoters respectively. Active chromatin has an enrichment value >1.00 (indicated by threshold line). ChIP, chromatin immunoprecipitation; H3AcK9/14, histone H3 acetylated on lysine 9 or 14; MeDIP, methylated DNA immunoprecipitation; QPCR, quantitative polymerase chain reaction; SBR, Smad binding region; TGF-β, transforming growth factor beta.
Figure 4
Figure 4
Strategy for integration of ChIP-chip and gene expression datasets to generate a core TGF-β/Smad3 tumor suppressor signature. The experimental strategy for identification of the TGF-β/Smad3 tumor suppressor signature (TSTSS) is shown. ChIP, chromatin immunoprecipitation; TGF-β, transforming growth factor beta.
Figure 5
Figure 5
Generation of core TGF-β/Smad3 tumor suppressor signature. (A) Unsupervised hierarchical clustering of differentially expressed Smad3 target genes in M3 and M4 cells treated with TGF-β in vitro for 6 hours. The 38 genes induced by TGF-β in vitro in M3 only were taken forward for further analysis. (B) RTQ-PCR validation of the 26 genes out of the original 38 genes that microarray analysis showed to be also regulated by TGF-β in M3 tumors in vivo. M3 tumors transduced with the dnTβRII represents the low TGF-β signal condition in vivo, while M3 tumors transduced with control lentivirus represents the high TGF-β signal condition in vivo. Expression was normalized to the low signal condition for each gene. Results are the mean +/−SEM for three tumors/experimental group. The difference between the high and low TGF-β signaling conditions is statistically significant (P <0.05; unpaired t test) for all genes shown. Note the six genes, marked by arrows, which are downregulated by TGF-β in vivo whereas they were upregulated in vitro. (C) Smad3 dependence of TGF-β regulation of select target genes in vivo. Further RT-QPCR quantitation was performed for six representative genes under the following conditions: (i) M3 cells treated with 5 ng/ml TGF-β (high TGF-β signal condition) or vehicle (low signal condition) in vitro; (ii) M3 tumors in vivo following transduction with a dnTβRII to block all TGF-β responses (low signal condition) or LacZ control lentivirus (high signal condition); (iii) M3 tumors in vivo following transduction with shSmad3 to block Smad3-mediated responses (low signal condition) or shGFP control lentivirus (high signal condition). Results are mean +/−SEM for three to six independent samples/group, normalized to low signaling condition. *statistically significant (P <0.05) for high vs. low signaling condition, unpaired t test. dnTβRII, dominant-negative type II TGF-β receptor; TGF-β, transforming growth factor beta.
Figure 6
Figure 6
Meta-analyses correlating TGF-β/Smad3 target genes with outcome in human breast cancer datasets. Kaplan-Meier analyses were performed using the online GOBO tool to assess the association of the TGF-β-regulated gene sets with distant metastasis-free survival (DMFS) in meta-analyses across multiple breast cancer cohorts (1,379 tumors from eight datasets). Patient datasets were dichotomized to higher than median expression (black) or lower than median expression (grey) of the gene set. P values were determined by the log-rank test. (A,B) Kaplan-Meier plots for survival of all patients in the GOBO datasets, using the set of TGF-β/Smad3 target genes that were uniquely regulated in M3 (the TSTSS). This gene set was designed to be enriched in genes involved in tumor suppression. Weighting (positive or negative) of individual target genes is based on the directionality of TGF-β-regulated gene expression observed in M3 tumors in vivo(A) or in M3 cells in vitro(B) as indicated. (C,D) Correlation of the TSTSS (using the in vivo directional weighting) with DMFS in ER+ (n = 856) (C), and ER- (n = 320) (D) patient subsets of the GOBO cohorts. ns, not significant. ER, estrogen receptor; GOBO, gene expression-based outcome for breast cancer online; TGF-β, transforming growth factor beta; TSS, transcriptional start site; TSTSS, TGF-β/Smad3 tumor suppressor signature.
Figure 7
Figure 7
Loss of TGF-β signaling leads to reduced tumor differentiation. (A) The TSTSS is weakly anticorrelated with proliferation, as assessed using a metaPCNA index, in ER+ but not ER- breast cancers (TCGA cohort). (B) Expression of the TSTSS inversely correlates with tumor grade in ER+ breast cancer (n = 904 patients), as assessed using GOBO tool. (C) Correlation between the TSTSS and luminal differentiation, as assessed using a meta-differentiation index, in ER+ and ER- tumors in the TCGA cohort. (D) Immunohistochemical staining of cytokeratin 8 (CK8) and ER-α in primary tumors from M3 cells expressing shGFP, shSmad2 or shSmad3. Scale bars represent 100 μm. (E) Quantitation of % area occupied by structures with a differentiated glandular histology in M3 tumors expressing shGFP (control), shSmad2 or ShSmad3. Results are mean +/−SEM for five tumors/group. (F) Quantitation of CK8 and ER staining was performed using Image-Pro Plus software. Each datapoint represents the mean of five fields/tumor, and results are shown as mean +/−SEM for five tumors/group. *P <0.05 for one-way ANOVA with Dunnett’s multiple comparison test; ns, not significant; hpf, high power field. ER, estrogen receptor; GOBO, gene expression-based outcome for breast cancer online; TGF-β, transforming growth factor beta; TSTSS, TGF-β/Smad3 tumor suppressor signature.
Figure 8
Figure 8
Ephrin signaling contributes to the tumor suppressive effects of TGF-β in ER+ breast cancer. (A) Pathway enrichment in the TSTSS assessed by Ingenuity Pathway Analysis. Fisher’s exact test with Benjamini-Hochberg (B-H) correction. The dotted line represents the P <0.05 significance threshold. (B) Correlation of TSTSS with meta-EFNA index in ER+ tumors of the TCGA cohort. (C) Association of meta-EFNA index with distant metastasis-free survival (DMFS) in ER+ breast cancer (n = 856 patients) using the GOBO tool. (D) Smad3 ChIP-QPCR at the EFNA1 locus in M3 and M4 cells. (E) ChIP-QPCR for H3AcK9/14 at the EFNA1 locus to identify active chromatin. (F) Time course of EFNA1 mRNA induction by TGF-β (2 ng/ml) in M3 and M4 cells. Results are mean +/−SEM of three determinations. *P <0.05. (G) Western blot of effect of TGF-β treatment of M3 cells on Ephrin A1 (EFNA1) expression and oncogenic signaling through phosphorylation of the EphA2 receptor on S897. EFNA-Fc was used as a positive control for activation of the EphA2 signaling path. (H) Western blot showing knockdown of EFNA1 in M3 cells. (I) Knockdown of EFNA enhances tumorigenesis in M3 cells. n = 8 to 10 mice/group. *P >0.05 one-way ANOVA, Tukey’s multiple comparison test. ChIP, chromatin immunoprecipitation; ER, estrogen receptor; GOBO, Gene expression-based Outcome for Breast cancer Online; H3AcK9/14, histone H3 acetylated on lysine 9 or 14; QPCR, quantitative polymerase chain reaction; TGF-β, transforming growth factor beta; TSTSS, TGF-β/Smad3 tumor suppressor signature.

References

    1. Reis-Filho JS, Weigelt B, Fumagalli D, Sotiriou C. Molecular profiling: moving away from tumor philately. Sci Transl Med. 2010;2:ps43. - PubMed
    1. Gatza ML, Lucas JE, Barry WT, Kim JW, Wang Q, Crawford MD, Datto MB, Kelley M, Mathey-Prevot B, Potti A, Nevins JR. A pathway-based classification of human breast cancer. Proc Natl Acad Sci U S A. 2010;107:6994–6999. - PMC - PubMed
    1. Massague J. TGFβ in cancer. Cell. 2008;134:215–230. - PMC - PubMed
    1. Ikushima H, Miyazono K. TGFβ signalling: a complex web in cancer progression. Nat Rev Cancer. 2010;10:415–424. - PubMed
    1. Pardali K, Moustakas A. Actions of TGF-β as tumor suppressor and pro-metastatic factor in human cancer. Biochim Biophys Acta. 2007;1775:21–62. - PubMed

Publication types

MeSH terms

Associated data