. 2014 Jun 2;6(6):a019307.
doi: 10.1101/cshperspect.a019307.

Epigenetic control of immunity

Affiliations

Epigenetic control of immunity

Meinrad Busslinger et al. Cold Spring Harb Perspect Biol. .

Abstract

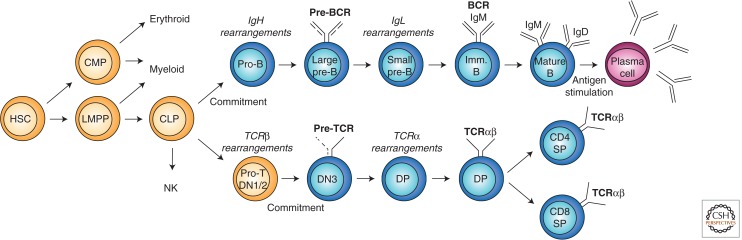
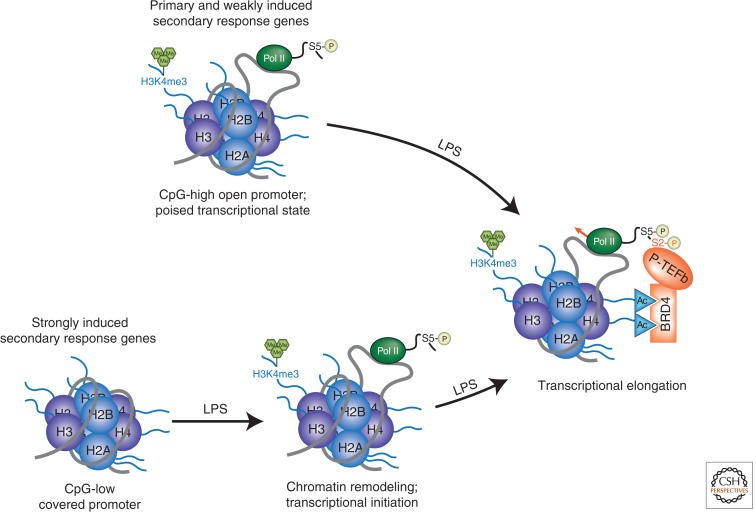
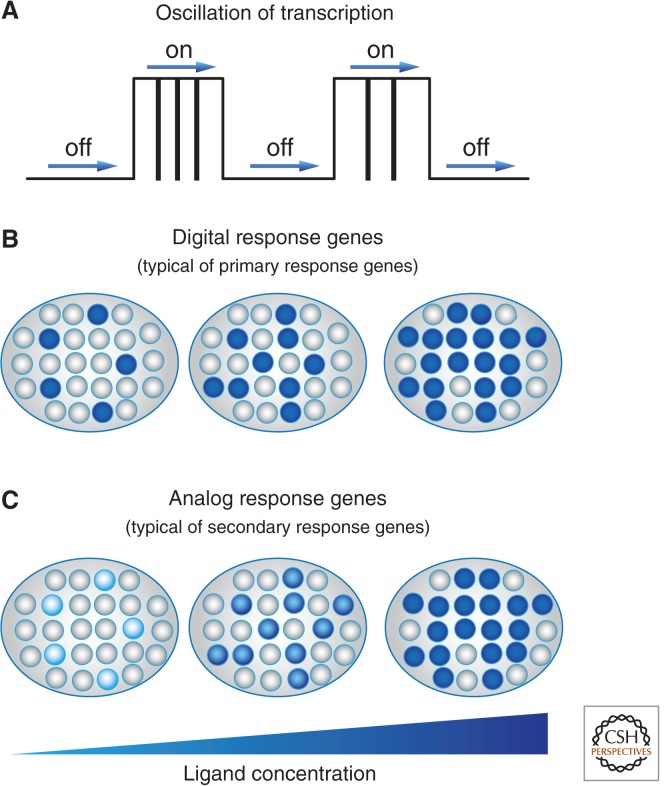
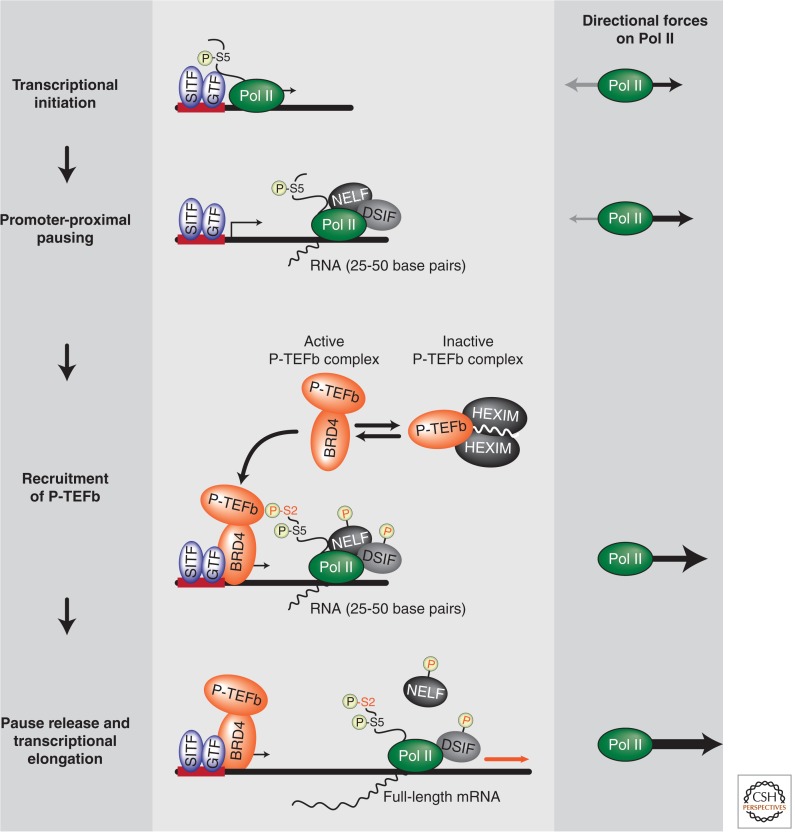
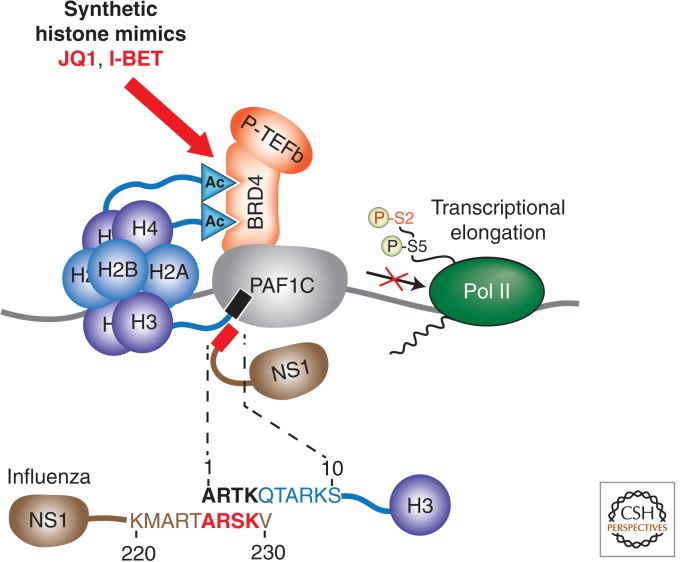
Immunity relies on the heterogeneity of immune cells and their ability to respond to pathogen challenges. In the adaptive immune system, lymphocytes display a highly diverse antigen receptor repertoire that matches the vast diversity of pathogens. In the innate immune system, the cell's heterogeneity and phenotypic plasticity enable flexible responses to changes in tissue homeostasis caused by infection or damage. The immune responses are calibrated by the graded activity of immune cells that can vary from yeast-like proliferation to lifetime dormancy. This article describes key epigenetic processes that contribute to the function of immune cells during health and disease.


Figures

Figure 1.
Figure 1.
Schematic diagram of B- and T-cell development. Hematopoietic stem cells (HSCs) differentiate via the indicated developmental stages to immunoglobulin-secreting plasma cells or CD4+ helper and CD8+ cytotoxic T cells. LMPP, lymphoid-primed multipotent progenitors; CMP, common myeloid progenitor; CLP, common lymphoid progenitor; DN, double negative; DP, double positive; SP, single positive. Orange, uncommitted progenitors; blue, committed lymphocytes; red, plasma cell.
Figure 2.
Figure 2.
Transcriptional control of early lymphopoiesis. (A) Progenitors of the B- and T-cell lineages develop from the HSC under the control of the indicated transcription factors. (B) Pax5 activates B-cell-specific genes involved in (pre) B-cell receptor (BCR) signaling, and represses lineage-inappropriate genes of the myeloid (FcRγ, CSF1R) or T-lymphoid (Notch1, CD28, Grap2) pathways. See Revilla-i-Domingo et al. (2012) for a more complete list of regulated Pax5 target genes.
Figure 3.
Figure 3.
Developmental plasticity of B lymphocytes. Committed CD19+ B lymphocytes and committed DN3 thymocytes undergo rapid transdifferentiation in vitro to macrophages in response to forced C/EBPα expression (red arrows) (Xie et al. 2004). Conditional Pax5 deletion allows committed pro-B cells and mature B cells to dedifferentiate in vivo to uncommitted lymphoid progenitors (LPs; green arrows) that subsequently develop into other hematopoietic cell types in the bone marrow or T cells in the thymus (black arrows) (Cobaleda et al. 2007). Committed lymphocytes are shown in blue.
Figure 4.
Figure 4.
Involvement of RAG1/2 in the formation of recombination centers. (A) Structure of the IgH locus. The murine IgH locus is composed of the 3′ proximal region of 270 kb length consisting of 16 DH, 4 JH, and 8 CH gene segments and of the distal VH gene cluster extending over a 2.5-Mb region containing 200 VH genes. (B) The recombination center model. In lymphoid progenitors, the proximal JH gene region of the IgH locus is activated as a recombination center under the control of the μ0 promoter and Eμ enhancer. Binding of the RAG2 PHD finger to the active H3K4me3 modification (green hexagons) in the recombination center recruits the RAG1/2 complex (brown oval), whose binding is further stabilized by the interaction of RAG1 with the JH RSS element (arrowhead). The tethered RAG1/2 complex captures one of several DH gene segments followed by DH-JH recombination. Blue triangles indicate acetylated lysine residues of histone H3.
Figure 5.
Figure 5.
Control of monoallelic V(D)J recombination and subnuclear location of the IgH locus in early B-cell development. (A) Control of monoallelic V(D)J recombination by pairing of IgH alleles. See Chapter 4.2 for detailed explanation of the model describing the regulation of V(D)J recombination at the IgH locus (black line) by the RAG1/2 endonuclease (brown) and repair-checkpoint protein ATM (yellow). (B) Subnuclear location of the two IgH alleles at different stages of early B-cell development. The distal VH region (red) and proximal JH-CH domain (green) of the IgH locus are indicated together with their location relative to the repressive compartments at the nuclear periphery (gray) and pericentromeric heterochromatin (blue). The contraction and decontraction of the IgH alleles are schematically shown.
Figure 6.
Figure 6.
Spatial regulation and IGCR1-mediated control of IgH recombination in early B-lymphopoiesis. (A) Reversible IgH contraction. The IgH locus is in an extended configuration in uncommitted progenitors, which allows DH-JH recombination to take place in the proximal domain. In pro-B cells, all 200 VH genes participate in VH-DJH rearrangements because of contraction of the IgH locus by looping. The VH genes of the incompletely rearranged IgH allele are no longer available for VH-DJH recombination because of decontraction in pre-B cells. (B) Control of IgH recombination by the IGCR1 insulator. See Chapter 4.6 for detailed description how the IGCR1 region controls the order of V(D)J recombination at the IgH locus. CTCF-binding regions (CBEs) are symbolized by red arrowheads. A brick wall indicates that the IGCR1 insulator restrains loop formation and recombination to the proximal IgH domain in uncommitted lymphoid progenitors. In pro-B cells, the IGCR1 element is neutralized by a so-far unknown mechanism, and locus contraction promotes VH-DJH rearrangements. 3′RR, 3′ regulatory region; Eμ, intronic enhancer.
Figure 7.
Figure 7.
Role of histone-modifying enzymes in leukemia and lymphoma. (A) Monoallelic mutation of the CREBBP (CBP) or EP300 (p300) gene results in reduced acetylation of BCL6, p53, and histone H3 in B-cell lymphoma. (B) Overexpression of the H3K36 dimethylase MMSET (NSD2, WHSC1) in multiple myeloma and loss of the H3K36 trimethylase SETD2 in early T-cell precursor acute lymphoblastic leukemia (ETP-ALL) contribute to tumorigenesis by altering the methylation state of lysine 36 of histone H3. (C) Loss of the H3K27 demethylase UTX as well as an altered specificity mutation and overexpression of the H3K27 methyltransferase EZH2 are implicated in the formation of B-cell malignancies by increasing the abundance of the repressive histone mark H3K27me3, whereas loss of EZH2 is associated with T-ALL. (D) Inactivation of the H3K4 methyltransferase MLL2 results in decreased levels of the active modification H3K4me3 in B-cell lymphoma, whereas MLL1 fusion proteins recruit the methyltransferase DOT1L to focally increase H3K79 methylation in MLL1-rearranged leukemias. The following color code is used: oncogenes (blue), tumor-suppressor genes (brown), active (green), and repressive (red) protein modifications.
Figure 8.
Figure 8.
Signaling control of LPS-induced gene expression. The Gram-negative bacteria-derived LPS binds to the surface-expressed Toll-like receptor 4 (TLR4). Binding to TLR4 leads to activation of cytosolic signaling proteins and ensuing activation of diverse transcription factors such as NF-κB (p50/p65) and AP-1 (Jun/Fos). Transcription factors enter the cell nucleus and bind to the promoters of proinflammatory genes. In numerous cases, binding of transcription factors requires prior chromatin remodeling that provides transcription factor access to the otherwise nucleosome-occluded regulatory regions.
Figure 9.
Figure 9.
Chromatin-mediated control of the temporal pattern of proinflammatory gene expression. Key features of chromatin associated with LPS-induced genes are shown. The emphasis is placed on the differences in the CpG content of the differentially induced gene promoters as well as the abundance of the chromatin mark H3K4m3 and serine 5-phosphorylated RNA Pol II, which is characteristic for the poised state of gene expression. In both the primary and secondary response genes, RNA elongation is supported by binding of BRD4 to acetylated histone H4. The histone-bound BRD4 recruits P-TEFb, which governs an initial phase of the RNA elongation process.
Figure 10.
Figure 10.
Dynamic control of gene expression. (A) Oscillatory dynamics of gene expression. The transition from the silent to active state is shown in a two-dimensional fashion. The rectangle represents the phase of active gene transcription and elongation (transcriptional burst), in which individual vertical bars indicate the number of transcripts generated during the burst. The transcriptional burst is followed by gene silencing. The amount of RNA transcripts produced per burst defines the size of the burst, and the number of bursts per defined time periods (from seconds to hours) corresponds to the burst frequency. (B,C) Genes can be induced in a “digital” (B) or “analog” (C) fashion. The responding or nonresponding cells are shown as closed or open circles, respectively. The graded color of the closed circles reflects differences in gene expression levels.
Figure 11.
Figure 11.
Coupling of transcriptional initiation to elongation. The key biochemical events that control the transition from transcriptional initiation to elongation are shown. The arrows shown to the right illustrate the combinatorial nature of forces acting on the RNA polymerase II (Pol II) at various phases of RNA expression. SITF, signal induced transcription factor; GTF, general transcription factors; P-S5, phosphorylation of serine 5 in the carboxy-terminal domain (CTD) of Pol II; NELF, negative elongation factor; DSIF, DRB sensitivity-inducing factor; P-TEFb, positive transcription-elongation factor-b; BRD4, bromodomain-containing protein 4; HEXIM, hexamethylene bis-acetimide inducible 1; P-S2, phosphorylation of serine 2 in the CTD of Pol II.
Figure 12.
Figure 12.
Control of gene expression by “histone mimics.” Nucleosomes contribute to the control of signal-induced transcriptional elongation by recruiting BRD4 and its associated P-TEFb complex via the acetylated amino-terminal tail of histone H4 and the PAF1 complex (PAF1C) via the amino-terminal ARTK motif of histone H3. The small molecules JQ1 and I-BET (red arrow) function as synthetic histone mimics by preventing the recruitment of BRD4 to promoters through competitive binding to BRD4 bromodomains. The carboxy-terminal ARSK sequence (red rectangle) of the influenza NS1 protein acts as a histone mimic by competing with the amino-terminal tail of histone 3 for binding to the PAF1 complex.

References

    1. Adelman K, Lis JT 2012. Promoter-proximal pausing of RNA polymerase II: Emerging roles in metazoans. Nat Rev Genet 13: 720–731 - PMC - PubMed
    1. Bacher CP, Guggiari M, Brors B, Augui S, Clerc P, Avner P, Eils R, Heard E 2006. Transient colocalization of X-inactivation centres accompanies the initiation of X inactivation. Nat Cell Biol 8: 293–299 - PubMed
    1. Bai L, Morozov AV 2010. Gene regulation by nucleosome positioning. Trends Genet 26: 476–483 - PubMed
    1. Bai L, Ondracka A, Cross FR 2011. Multiple sequence-specific factors generate the nucleosome-depleted region on CLN2 promoter. Mol Cell 42: 465–476 - PMC - PubMed
    1. Balazsi G, van Oudenaarden A, Collins JJ 2011. Cellular decision making and biological noise: From microbes to mammals. Cell 144: 910–925 - PMC - PubMed