. 2014 Oct;20(10):3147-58.
doi: 10.1111/gcb.12647. Epub 2014 Jul 21.

Vegetation productivity patterns at high northern latitudes: a multi-sensor satellite data assessment

Affiliations
Free PMC article

Vegetation productivity patterns at high northern latitudes: a multi-sensor satellite data assessment

Kevin C Guay et al. Glob Chang Biol. 2014 Oct.
Free PMC article

Abstract

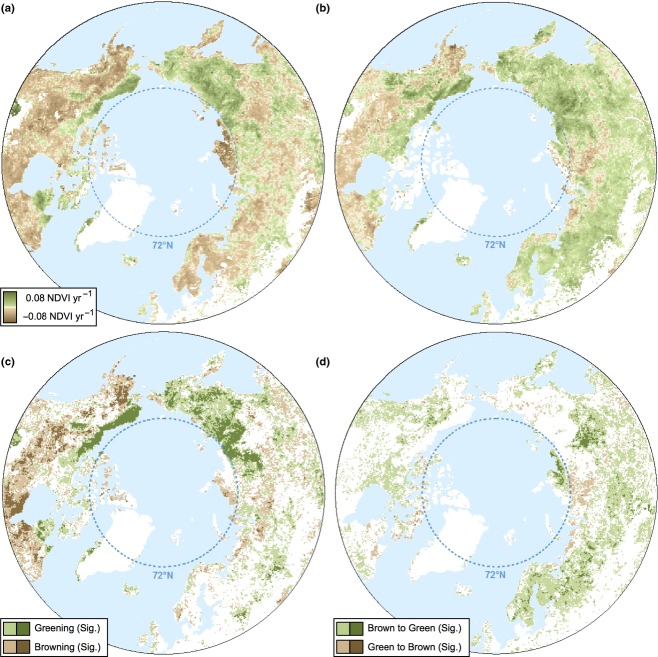
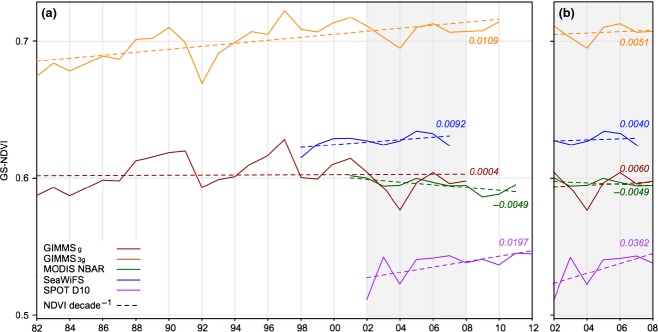
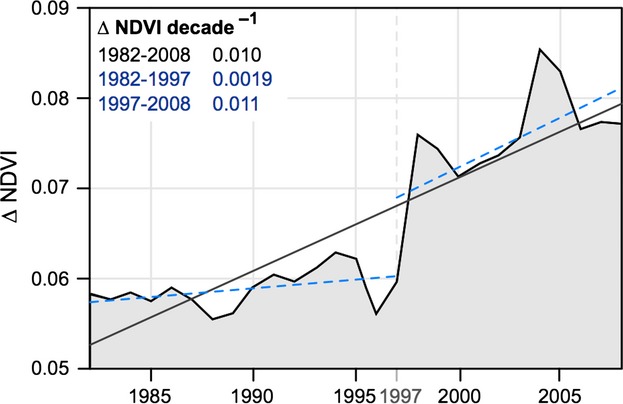
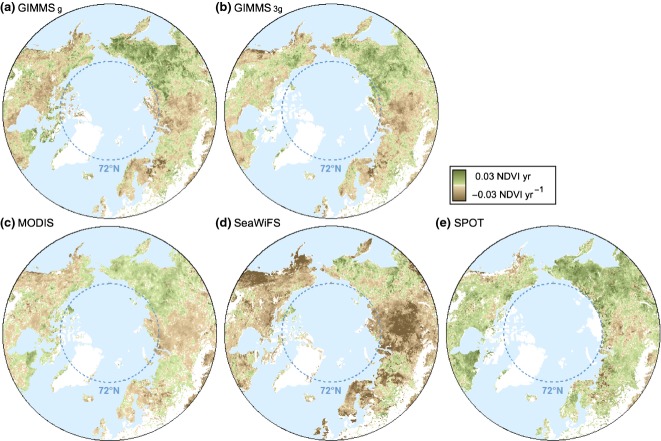
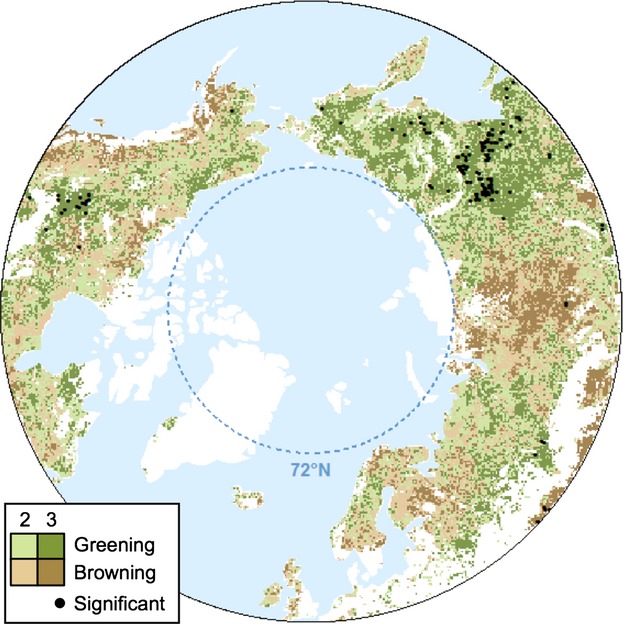
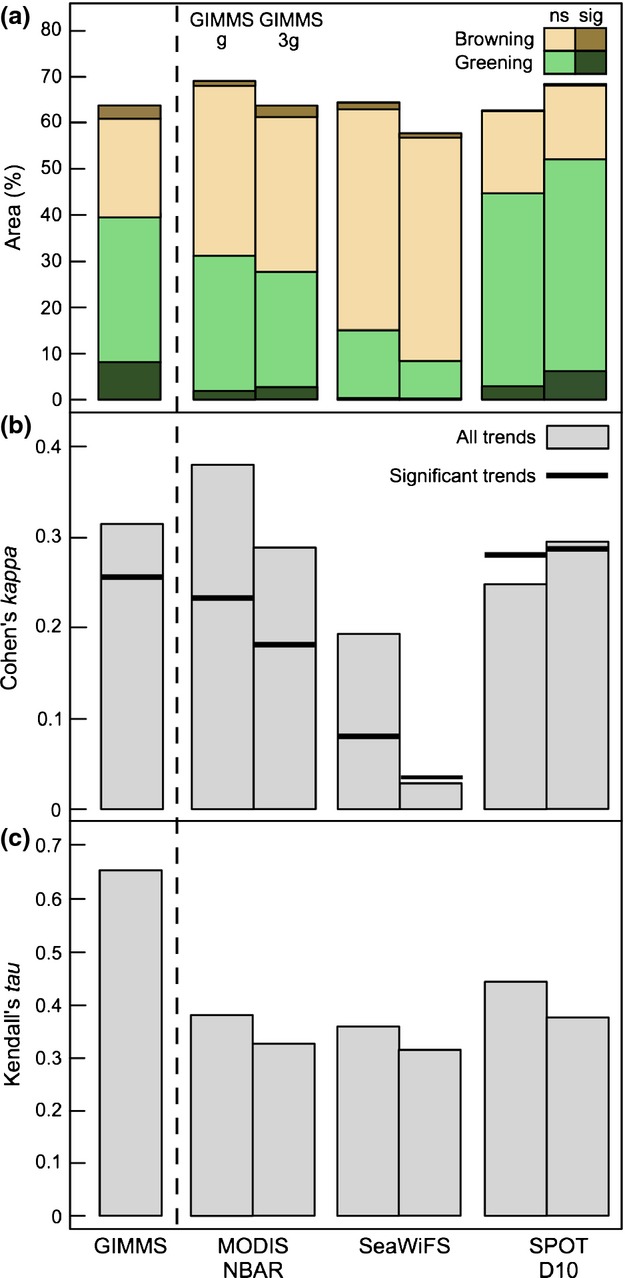
Satellite-derived indices of photosynthetic activity are the primary data source used to study changes in global vegetation productivity over recent decades. Creating coherent, long-term records of vegetation activity from legacy satellite data sets requires addressing many factors that introduce uncertainties into vegetation index time series. We compared long-term changes in vegetation productivity at high northern latitudes (>50°N), estimated as trends in growing season NDVI derived from the most widely used global NDVI data sets. The comparison included the AVHRR-based GIMMS-NDVI version G (GIMMSg ) series, and its recent successor version 3g (GIMMS3g ), as well as the shorter NDVI records generated from the more modern sensors, SeaWiFS, SPOT-VGT, and MODIS. The data sets from the latter two sensors were provided in a form that reduces the effects of surface reflectance associated with solar and view angles. Our analysis revealed large geographic areas, totaling 40% of the study area, where all data sets indicated similar changes in vegetation productivity over their common temporal record, as well as areas where data sets showed conflicting patterns. The newer, GIMMS3g data set showed statistically significant (α = 0.05) increases in vegetation productivity (greening) in over 15% of the study area, not seen in its predecessor (GIMMSg ), whereas the reverse was rare (<3%). The latter has implications for earlier reports on changes in vegetation activity based on GIMMSg , particularly in Eurasia where greening is especially pronounced in the GIMMS3g data. Our findings highlight both critical uncertainties and areas of confidence in the assessment of ecosystem-response to climate change using satellite-derived indices of photosynthetic activity. Broader efforts are required to evaluate NDVI time series against field measurements of vegetation growth, primary productivity, recruitment, mortality, and other biological processes in order to better understand ecosystem responses to environmental change over large areas.

Keywords: GIMMS; MODIS NBAR; NDVI3g; SPOT D10; SeaWiFS; arctic; boreal; climate change; normalized difference vegetation index.


Figures

Fig 1
Fig 1
Trends in growing season NDVI (GS-NDVI) for (a) GIMMSg and (b) GIMMS3g. Trends were calculated using the Theil–Sen approach over the period 1982–2008, which is the common record between both data sets. Croplands and water bodies were excluded. For maps depicting significant trends only, see Figure S4. The bottom two panels show areas where (c) both products agree in GS-NDVI trend direction and (d) where the products disagree. Areas where GIMMSg indicated browning and GIMMS3g indicated greening are labeled ‘Brown to Green’ and areas where GIMMSg showed greening and GIMMS3g showed browning are labeled ‘Green to Brown’. Dark colors indicate significant greening and significant browning (< 0.05).
Fig 2
Fig 2
(a) Mean annual GS-NDVI for GIMMSg, GIMMS3g, MODIS NBAR, SeaWiFS, and SPOT D10 at naturally vegetated areas north of 50°N for the full available record for each product, and (b) the common record (2002–2008) of all data sets, excluding SeaWiFS which uses the period from 2002 to 2007.
Fig 3
Fig 3
The annual difference between mean GS-NDVI in GIMMS3g and GIMMSg for naturally vegetated area between of 50°N and 72°N. The average rate of change (slope), estimated using least squares regression, is shown by the solid line. The dotted lines show the rate of change before and after 1997.
Fig 4
Fig 4
Trends in GS-NDVI derived from (a) GIMMSg, (b) GIMMS3g, (c) MODIS NBAR, (d) SeaWiFS, and (e) SPOT D10 using the common record (2002–2008*) and estimated using the Theil–Sen approach. Significant trends are shown in Figure S6. *SeaWiFS uses the period 2002–2007.
Fig 5
Fig 5
Agreement in the direction of GS-NDVI trends estimated for GIMMS3g, MODIS NBAR, and SPOT D10 over the common record (2002–2008). Dark colors show areas where GIMMS3g, MODIS NBAR, and SPOT D10 agree on the sign of the trend, while light colors indicate disagreement (i.e., two products agree and one product disagrees). Trends are assessed for statistical significance using the Mann-Kendall test (< 0.05). Black dots represent areas where all three data products indicate either significant greening or browning trends. Agricultural lands and areas north of 72°N are masked from the maps.
Fig 6
Fig 6
(a) The fraction of naturally vegetated area between 50°N and 72°N where GIMMSg and GIMMS3g (left and right bars, respectively) show similar trends in GS-NDVI as MODIS NBAR, SeaWiFS and SPOT D10 data products, over their respective periods of overlap (Figure S9). Green (bottom section of each bar) and brown (top section of each bar) indicate increases and decreases in GS-NDVI, respectively. Areas where both data sets show similar statistically significant trends are shown in dark colors. The Theil–Sen test was used to determine trend direction while the Mann–Kendall test was used to assess statistical significance. (b) Agreement between the sign of GS-NDVI trends in pairs of data products is estimated using Cohen's kappa. Bars indicate the level of agreement between all trends regardless of statistical significance and bold lines indicate agreement after non-significant trends are considered separately. (c) The correlation between product-pairs, based on per-pixel comparisons of detrended annual GS-NDVI values, quantified using Kendall's tau and averaged across all pixels. In a, b, and c, the bar to the left of the dotted line compares GIMMSg to GIMMS3g. The bars to the right of the dotted line compare GIMMSg and GIMMS3g to MODIS, SeaWiFS, and SPOT.

References

    1. Baccini A, Laporte NT, Goetz SJ, Sun M, Dong H. A first map of tropical Africa's above-ground biomass derived from satellite imagery. Environmental Research Letters. 2008:045011.
    1. Baccini A, Goetz SJ, Walker WS, et al. Estimated carbon dioxide emissions from tropical deforestation improved by carbon-density maps. Nature Climate Change. 2012;2:182–185.
    1. Baldi G, Nosetto MD, Aragón R, Aversa F, Paruelo JM, Jobbágy EG. Long-term satellite NDVI data sets: evaluating their ability to detect ecosystem functional changes in South America. Sensors. 2008;8:5397–5425. - PMC - PubMed
    1. Barichivich J, Briffa KR, Myneni RB, et al. Large-scale variations in the vegetation growing season and annual cycle of atmospheric CO2 at high northern latitudes from 1950 to 2011. Global Change Biology. 2013;19:3167–3183. - PubMed
    1. Beck PSA, Goetz SJ. Satellite observations of high northern latitude vegetation productivity changes between 1982 and 2008: ecological variability and regional differences. Environmental Research Letters. 2011;7:029501.

Publication types