. 2014 Jul 1;193(1):400-11.
doi: 10.4049/jimmunol.1303236. Epub 2014 Jun 2.

Characterization of conventional and atypical receptors for the chemokine CCL2 on mouse leukocytes

Affiliations

Characterization of conventional and atypical receptors for the chemokine CCL2 on mouse leukocytes

Laura B Ford et al. J Immunol. .

Abstract

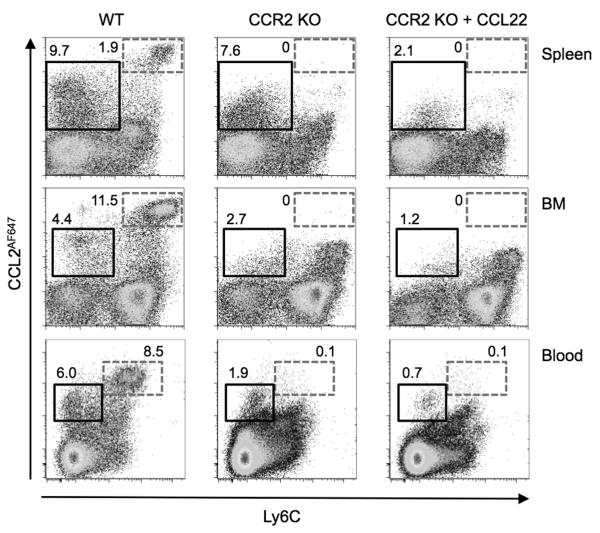
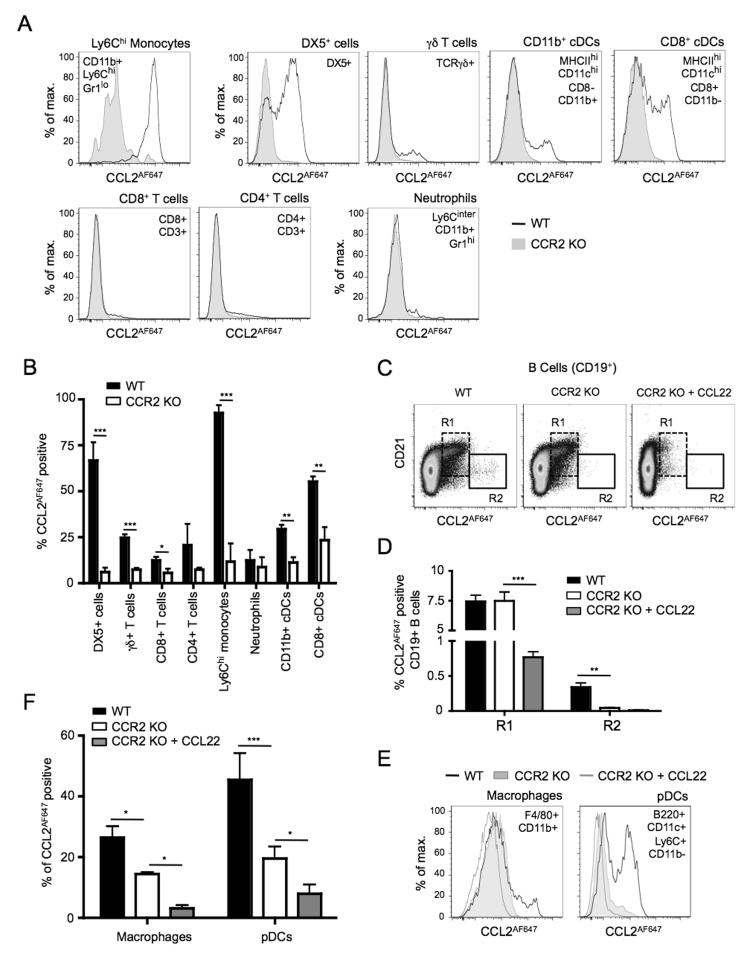
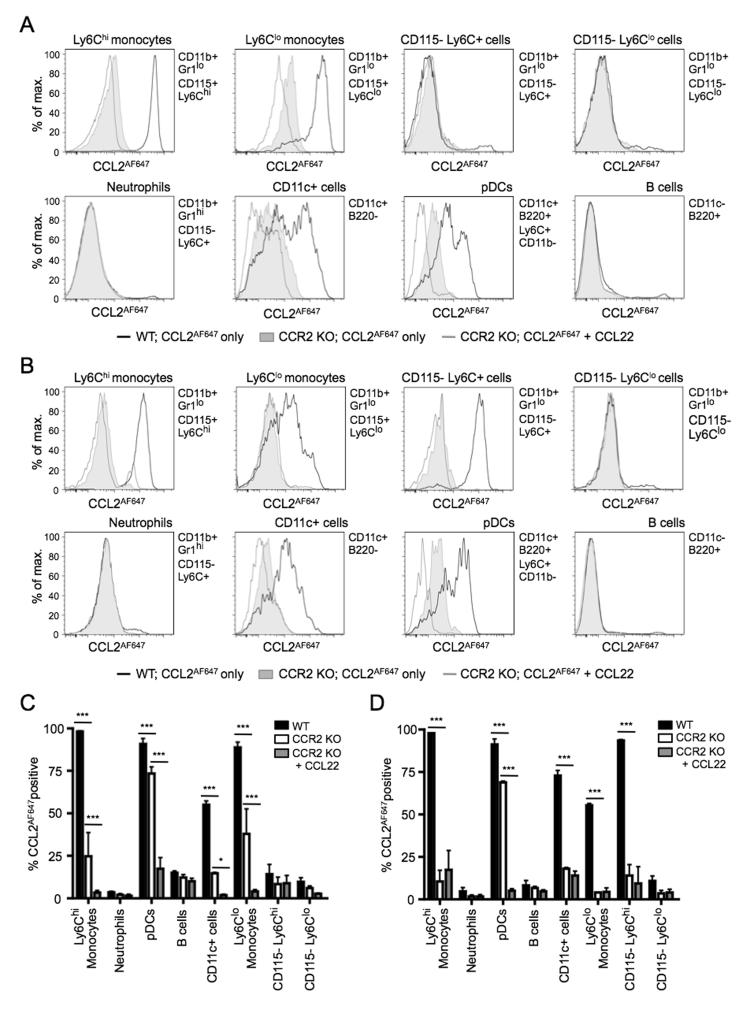
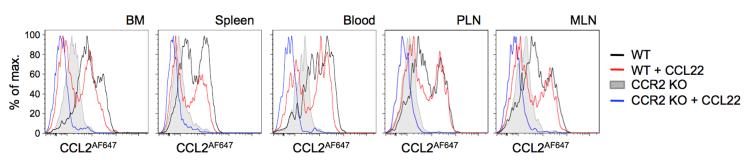
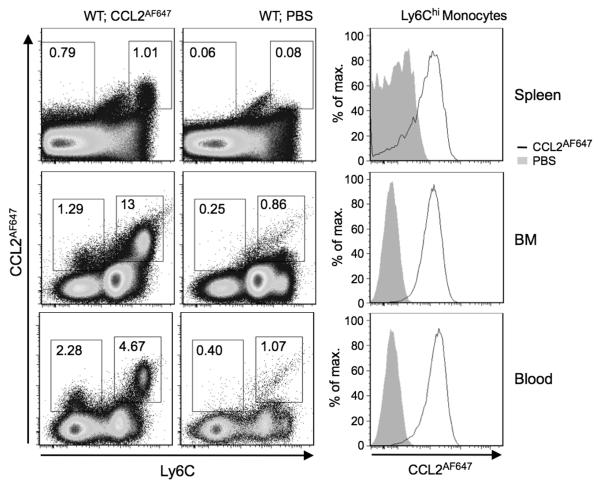
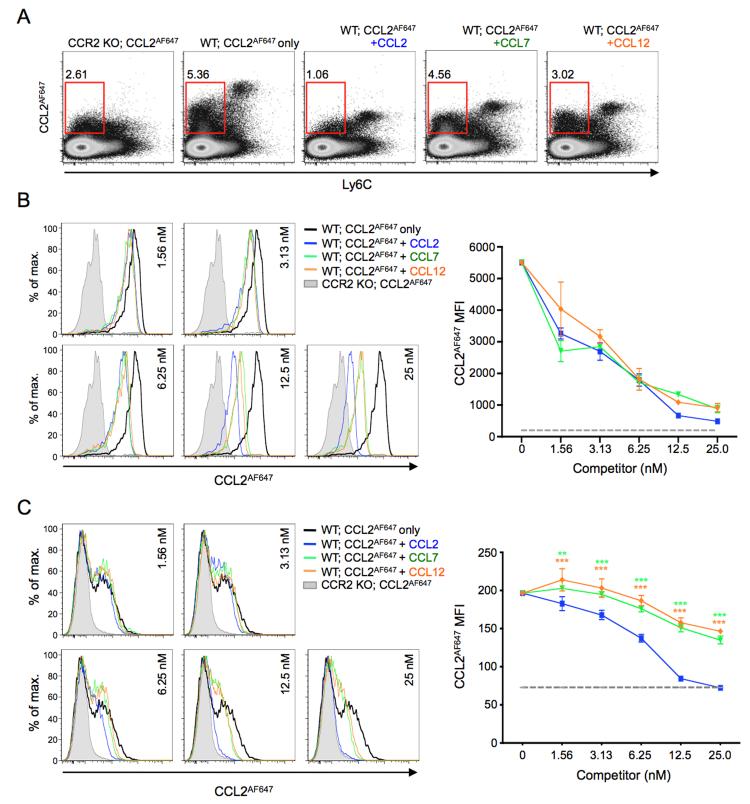
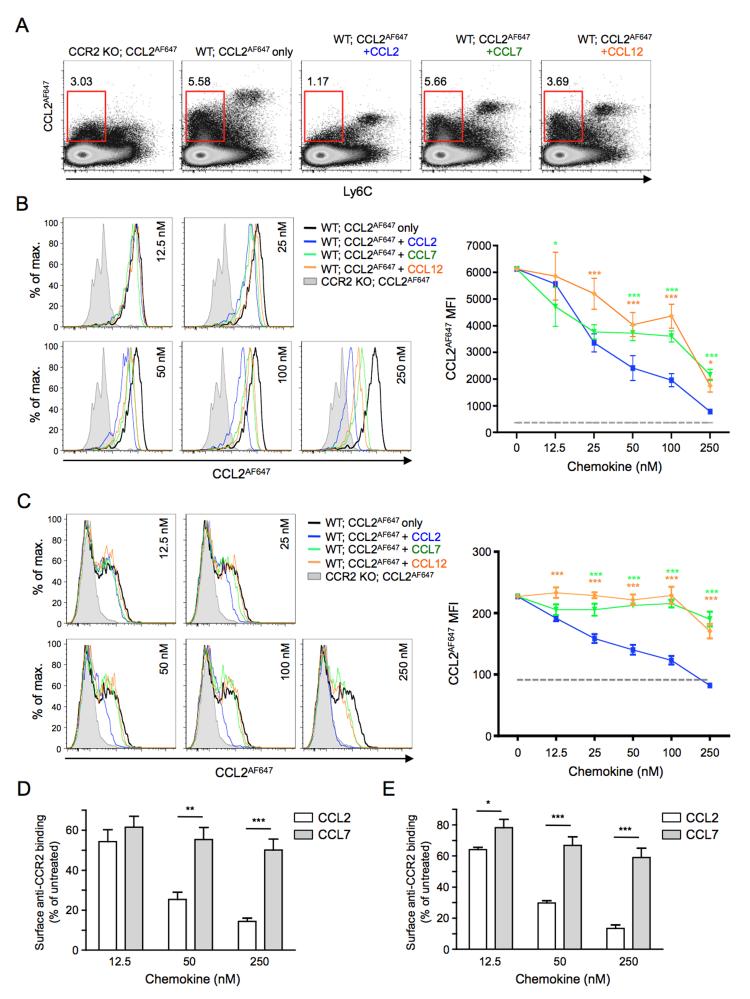
Chemokine-directed leukocyte migration is crucial for effective immune and inflammatory responses. Conventional chemokine receptors (cCKRs) directly control cell movement; atypical chemokine receptors (ACKRs) regulate coexpressed cCKRs; and both cCKRs and ACKRs internalize chemokines to limit their abundance in vivo, a process referred to as scavenging. A leukocyte's migratory and chemokine-scavenging potential is determined by which cCKRs and ACKRs it expresses, and by the ligand specificity, signaling properties, and chemokine internalization capacity of these receptors. Most chemokines can bind at least one cCKR and one ACKR. CCL2 can bind to CCR2 (a cCKR) and two ACKRs (ACKR1 and ACKR2). In this study, by using fluorescent CCL2 uptake to label cells bearing functional CCL2 receptors, we have defined the expression profile, scavenging activity, and ligand specificity of CCL2 receptors on mouse leukocytes. We show that qualitative and quantitative differences in the expression of CCR2 and ACKR2 endow individual leukocyte subsets with distinctive CCL2 receptor profiles and CCL2-scavenging capacities. We reveal that some cells, including plasmacytoid dendritic cells, can express both CCR2 and ACKR2; that Ly6C(high) monocytes have particularly strong CCL2-scavenging potential in vitro and in vivo; and that CCR2 is a much more effective CCL2 scavenger than ACKR2. We confirm the unique, overlapping, ligand specificities of CCR2 and ACKR2 and, unexpectedly, find that cell context influences the interaction of CCL7 and CCL12 with CCR2. Fluorescent chemokine uptake assays were instrumental in providing these novel insights into CCL2 receptor biology, and the sensitivity, specificity, and versatility of these assays are discussed.


Figures

Figure 1
Figure 1. CCL2AF647 uptake enables specific and sensitive detection of CCL2 receptors on mouse leukocytes
Cells from the spleen, BM and blood WT or Ccr2−/− (CCR2 KO) mice were incubated with CCL2AF647 (+/− 10-fold molar excess of unlabelled CCL22), stained with fluorescently labeled anti-Ly6C Ab, and examined by flow cytometry. Dead cells and cell doublets were excluded by pre-gating. The boxes indicate populations of cells discussed in the Results text, and the adjacent numbers represent the percentage of live cells found in the box, rounded to one decimal place. Data are representative of three of more repeat experiments each containing three or more individual mice per genotype.
Figure 2
Figure 2. CCL2AF647 uptake identifies splenic leukocyte subsets expressing CCR2 and/or ACKR2
WT and Ccr2−/− (CCR2 KO) splenocytes were incubated with CCL2AF647 (+/− a 10-fold molar excess of unlabelled CCL22), stained with fluorescently labeled Abs, and examined by flow cytometry. Dead cells and cell doublets have been excluded from all data. (A & E) Overlaid CCL2AF647 uptake profiles of WT and CCR2 KO splenic leukocyte subsets identified by the surface immunophenotype indicated. (B) Mean percentage (+SD) of CCL2AF647 positive cells in splenic leukocyte subsets (n=3). CCL2AF647 positive WT cells were defined based on arbitrary gates set using equivalent populations of CCR2 KO splenocytes. The percentage of CCL2AF647 positive CCR2 KO cells remaining in this gate is shown in the white columns. *p<0.05, **p<0.01, ***p<0.001 using Student’s t test. (C) Dot-plots of live splenic B cells (CD19+) showing CCL2AF647 uptake against CD21 expression. R1 and R2 identify cells with specific CCL2AF647 uptake properties that are discussed in the Results text. (D) Mean percentage (+SD) of CCL2AF647 positive cells in R1 and R2 (n=3). (F) Mean percentage (+SD) of CCL2AF647 positive WT and CCR2 KO splenic macrophages and pDCs (n=3). CCL2AF647 positive WT and CCR2 KO cells were defined based on arbitrary gates set using equivalent populations of CCR2 KO splenocytes that had been incubated with CCL2AF647 and an excess of unlabelled CCL22. The percentage of CCL2AF647 positive cells in this gate is shown in the white columns. In D and F, data were analyzed using one-way ANOVA with Tukey post-test, *p<0.05, **p<0.01, ***p<0.001. Data are representative of four of more repeat experiments each containing three or more individual mice per genotype.
Figure 3
Figure 3. Cells expressing CCL2 receptors in mouse BM and blood
Cells from WT or Ccr2−/− (CCR2 KO) BM (A and C) or blood (B and D) cells were incubated with CCL2AF647 (+/− a 10-fold molar excess of unlabelled CCL22), stained with fluorescently labeled Abs, and examined by flow cytometry. Dead cells and cell doublets have been excluded from all data. Leukocyte subsets were identified using the surface immunophenotype indicated to the right of each histogram overlay and using the gating strategy shown in Supplementary Figure 3. (A-B) Representative overlaid histograms of CCL2AF647 uptake profiles for each of the populations indicated. A, BM; B, blood. (C-D) Mean percentage (+SD) of CCL2AF647 positive cells in each leukocyte subset (n=3). CCL2AF647 positive WT cells were defined based on arbitrary gates set using equivalent populations of CCR2 KO BM cells that had been incubated with CCL2AF647 and CCL22: the percentage of cells in this gate is shown (grey columns). Data were analyzed using one-way ANOVA with Tukey post-test, *p<0.05, ***p<0.001. Three of more repeat experiments generated similar datasets.
Figure 4
Figure 4. pDCs express CCR2 and ACKR2
Cells from blood and the tissues indicated of WT and Ccr2−/− (CCR2 KO) mice were incubated with CCL2AF647 +/− a 10-fold molar excess of CCL22. pDC were identified as shown in Supplementary Figures 2-4. Overlaid histograms are shown of CCL2AF647 uptake by pDCs and are representative of data from three or more repeat experiments, each containing at least three mice per genotype. MLN, mesenteric lymph node; PLN, skin-draining peripheral lymph node.
Figure 5
Figure 5. Ly6Chi monocytes scavenge CCL2AF647 in live mice
1μg of CCL2AF647 in PBS, or PBS alone, was injected i.v. into WT mice. Cells were isolated from spleen, BM and blood 2h later, labeled with fluorescently labeled Abs, and analyzed by flow cytometry. In the dot-plots, CCL2AF647 uptake is plotted against Ly6C expression. The percentage of cells in each gate, as a proportion of live cells, is shown. The histograms show CCL2AF647 uptake by Ly6Chi monocytes, identified as in Supplementary Figures 2 and 3. Plots are representative of data from two independent experiments, each containing at least three mice per treatment.
Figure 6
Figure 6. Mouse CCR2 ligands show unique, cell type-specific interactions with CCR2
(A) Representative flow cytometry profiles showing CCL2AF647 uptake by WT and Ccr2−/− (CCR2 KO) splenocytes in the presence or absence of 25nM unlabelled CCL2, CCL7 or CCL12, as indicated. Cells were separated according to Ly6C expression. Red boxes gate CCL2AF647-positive Ly6C cells, and the percentage of cells in this gate, as a proportion of live cells, is shown. (B-C) Left panels: Representative overlaid histogram plots showing CCL2AF647 uptake by live (B) Ly6Chi monocytes or (C) CD11b+Ly6C cells from WT and Ccr2−/− (CCR2 KO) spleens in the presence or absence of a range of concentrations of unlabelled CCL2, CCL7 or CCL12, as indicated. The right panels show the average mean fluorescent intensity (MFI) (+/−SD) of CCL2AF647 uptake by (B) Ly6Chi monocytes or (C) CD11b+ Ly6C cells (n=3 WT mice). CCL2AF647 uptake by CCR2 KO cells is indicated by the grey dotted line. Data were analyzed by two-way ANOVA with Bonferroni post test, **p<0.01, ***p<0.001 (green, CCL2 vs. CCL7; orange, CCL2 vs. CCL12). Dead cells and cell doublets have been excluded from all data shown. Two or more repeat experiments yielded similar results.
Figure 7
Figure 7. Ligand- and cell type-specific modification of CCR2 behavior
(A) Representative flow cytometry profiles showing CCL2AF647 uptake by WT and Ccr2−/− (CCR2 KO) splenocytes that had been pre-incubated for 30 minutes with or without 250nM unlabelled CCL2, CCL7 or CCL12, as indicated. Cells were separated according to Ly6C expression. Red boxes gate CCL2AF647-positive Ly6C cells, and the percentage of cells in this gate, as a proportion of live cells, is shown. (B-C) Left panels: Representative overlaid histogram profiles showing CCL2AF647 uptake by (B) Ly6Chi monocytes or (C) CD11b+Ly6C cells from WT and Ccr2−/− (CCR2 KO) spleens pre-incubated for 30 minutes with or without a range of concentrations of unlabelled CCL2, CCL7 or CCL12, as indicated. The right panels show the average mean fluorescent intensity (MFI) (+/−SD) of CCL2AF647 uptake by (B) Ly6Chi monocytes or (C) CD11b+ Ly6C cells (n=3 WT mice). CCL2AF647 uptake by CCR2 KO cells is shown by the grey dotted line. Data were analyzed by two-way ANOVA with Bonferroni post test, *p<0.05, ***p<0.001 (green, CCL2 vs. CCL7; orange, CCL2 vs. CCL12). (D) WT and Ccr2−/− splenocytes were incubated for 30 minutes with or without unlabelled CCL2 or CCL7 (12.5nM, 50nM or 250nM), and Ly6Chi monocytes then examined for their ability to bind anti-CCR2 antibody. (E) Cells were treated as in D, except that, before labeling with antibodies, cells that had been exposed to unlabeled chemokines were washed thoroughly and allowed to internalize CCL2AF647 for 1h at 37°C. In D and E, the average mean fluorescence intensity (MFI) of anti-CCR2-stained Ccr2−/− cells was subtracted from the MFI of anti-CCR2-stained WT cells. Anti-CCR2 binding to chemokine-treated cells was then calculated as a percentage of that seen with WT cells that had not been exposed to any chemokine (mean (+SEM) n=3). Data were analyzed using a Student’s t test: *p<0.05, **p<0.01, ***p<0.001. Dead cells and cell doublets have been excluded from all data shown. Two or more repeat experiments gave comparable results.

Similar articles

Cited by

References

    1. Zlotnik A, Yoshie O. The chemokine superfamily revisited. Immunity. 2012;36:705–716. - PMC - PubMed
    1. Bachelerie F, Ben-Baruch A, Burkhardt AM, Combadière C, Farber JM, Graham GJ, Horuk R, Sparre-Ulrich AH, Locati M, Luster AD, Mantovani A, Matsushima K, Murphy PM, Nibbs R, Nomiyama H, Power CA, Proudfoot AEI, Rosenkilde MM, Rot A, Sozzani S, Thelen M, Yoshie O, Zlotnik A. International Union of Pharmacology. LXXXIX. Update on the Extended Family of Chemokine Receptors and Introducing a New Nomenclature for Atypical Chemokine Receptors. Pharmacol Rev. 2014;66:1–79. - PMC - PubMed
    1. Nibbs RJB, Graham GJ. Immune regulation by atypical chemokine receptors. Nat Rev Immunol. 2013;13:815–829. - PubMed
    1. Volpe S, Cameroni E, Moepps B, Thelen S, Apuzzo T, Thelen M. CCR2 Acts as Scavenger for CCL2 during Monocyte Chemotaxis. PLoS ONE. 2012;7:e37208. - PMC - PubMed
    1. Cardona AE, Sasse ME, Liu L, Cardona SM, Mizutani M, Savarin C, Hu T, Ransohoff RM. Scavenging roles of chemokine receptors: chemokine receptor deficiency is associated with increased levels of ligand in circulation and tissues. Blood. 2008;112:256–263. - PMC - PubMed

Publication types

LinkOut - more resources