. 2014 Jul 1;193(1):208-22.
doi: 10.4049/jimmunol.1303398. Epub 2014 Jun 2.

Bovine γδ T cells are a major regulatory T cell subset

Affiliations

Bovine γδ T cells are a major regulatory T cell subset

Efrain Guzman et al. J Immunol. .

Abstract

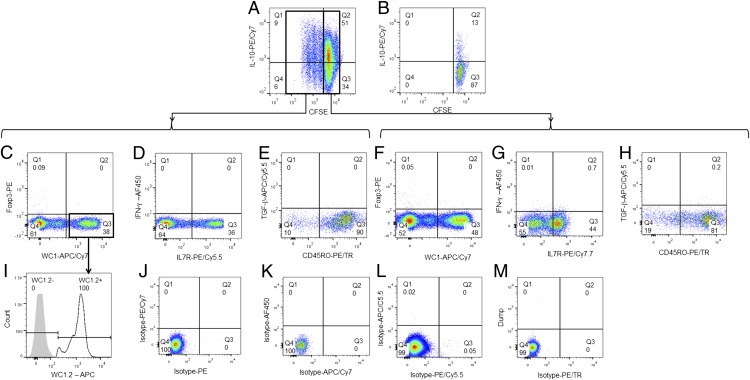
In humans and mice, γδ T cells represent <5% of the total circulating lymphocytes. In contrast, the γδ T cell compartment in ruminants accounts for 15-60% of the total circulating mononuclear lymphocytes. Despite the existence of CD4(+)CD25(high) Foxp3(+) T cells in the bovine system, these are neither anergic nor suppressive. We present evidence showing that bovine γδ T cells are the major regulatory T cell subset in peripheral blood. These γδ T cells spontaneously secrete IL-10 and proliferate in response to IL-10, TGF-β, and contact with APCs. IL-10-expressing γδ T cells inhibit Ag-specific and nonspecific proliferation of CD4(+) and CD8(+) T cells in vitro. APC subsets expressing IL-10 and TFG-β regulate proliferation of γδ T cells producing IL-10. We propose that γδ T cells are a major regulatory T cell population in the bovine system.


Figures

FIGURE 1.
FIGURE 1.
γδ T cells express IL-10 ex vivo. Whole blood was collected in heparin and incubated for 4 h at 37°C in the presence of brefeldin A (BFA). Cells were then fixed, permeabilized, stained, and analyzed by flow cytometry. (A) Frequencies of CD4+ and CD8+ T cells. (B) Expression of IL-10 and Foxp3 in the CD4+ population. (C) Isotype and fluorochrome controls for PE and PE/Cy5.5. (D) Frequencies of γδ TCR+ and the WC1+ subset. (E) Expression of IL-10 and Foxp3 in the γδ TCR+ population. (F) WC1 phenotype of IL-10+ γδ TCR+ cells. (G) WC1.1 and (H) WC1.2 phenotype of IL-10+ γδ TCR+ WC1+ cells. Plots are representative of cells obtained from 16 different animals. Shaded histograms represent isotype and fluorochrome controls. (I) Frequency of CD4+, CD8+ and γδ TCR+ expressing IL-10. (J) Phenotype of γδ TCR+ IL-10+ cells based on WC1 expression. (K) Phenotype of γδ TCR+ IL-10+ WC1+ based on WC1-subgroup expression. Bars represent means of cells taken from animals (n = 16) and analyzed in duplicate. Error bars indicate SE of the means.
FIGURE 2.
FIGURE 2.
Depletion of γδ T cells increases Ag-specific responses in vitro. PBMCs from animals vaccinated with FMDV were depleted of the γδ TCR+ cells and cultured with FMDV Ag for 5 d. CD4+ and CD8+ FMDV-specific responses were analyzed by flow cytometry and compared with nondepleted samples. (A) Proliferation of CD8+ T cells and (B) proliferation of CD4+ T cells in response to FMDV measured by CFSE dilution. Gray histograms show nonspecific proliferation to media only; white histograms show Ag-specific proliferation in the presence of γδ T cells; hatched histograms show Ag-specific proliferation in γδ-depleted PBMCs. (CF) IFN-γ, IL-2, and IL-4 expression in CD8+ (C and E) and CD4+ (D and F) T cells after stimulation with FMDV Ag in γδ T cell–depleted samples (E and F) or nondepleted samples (C and D). Histograms and dot plots are representative of cells from 10 different animals analyzed in duplicate. Only live/single events were analyzed. Quadrants were based on isotype staining (data not shown). Specific cytokine responses to FMDV and nonspecific responses to BVDV from culture supernatants were tested by ELISA and compared with nondepleted samples. (G) IFN-γ. (H) IL-2. (I) IL-4. Bars indicate means (n = 10, analyzed in duplicate), and error bars indicate SEMs.
FIGURE 3.
FIGURE 3.
Inhibition of Ag-specific IFN-γ by γδ TCR+ subsets. PBMCs from FMDV-vaccinated animals were stimulated with media or FMDV Ag in the presence or absence of γδ TCR+ subsets. (A) IFN-γ expression to media only. (B) IFN-γ expression in PBMCs. (C) IFN-γ expression in γδ TCR-depleted PBMCs. (D) IFN-γ expression in γδ TCR-depleted PBMCs with WC1 cells added back. (E) IFN-γ expression in γδ TCR-depleted PBMCs with WC1+ WC1.1+ WC1.2 cells added back. (F) IFN-γ expression in γδ TCR-depleted PBMCs with WC1+ WC1.1 WC1.2+ cells added back. MACS-purified γδ T cell subsets were added back at a ratio of 1 PBMC to 1 γδ T cell. Plots representative of cells taken from 10 animals and analyzed in duplicate. (G) Bar graph showing percentages of FMDV-specific IFN-γ+ cells in the presence of γδ T cell subsets. Bars represent means (n = 10); error bars represent SEMs; *p < 0.05, **p < 0.005.
FIGURE 4.
FIGURE 4.
Expansion of IL-10–expressing γδ T cells in vitro. γδ T cells were MACS sorted and tested for their ability to expand in vitro. (A) γδ T cells cultured with autologous monocytes (CD14+) and media only for 5 d. (B) γδ T cells cultured with rIL-2, anti-CD3, and anti-CD28 for 5 d. Phenotype of CFSElow (CE) and CFSEhigh (FH) γδ T cells: (C and F) expression of Foxp3/WC1; (D and G) IFN-γ/IL-7R; (E and H) TGF-β/CD45RO; and (I) WC1-subgroup phenotype of CFSElow γδ TCR+ cells. Isotype controls (JM) for each of the fluorochromes used is also shown. Plots are representative of cells from 10 different animals analyzed in duplicate. Only live/singe events were analyzed.
FIGURE 5.
FIGURE 5.
In vitro–expanded γδ T cells inhibit nonspecific and Ag-specific proliferation and function of αβ T cells. (A) CD4+ T cells were cultured with autologous CD14+ cells in the presence of IL-2, anti-CD3, and anti-CD28 in the absence (gray histogram shows spontaneous proliferation without stimulus. hatched histogram) or presence (white histogram) of in vitro–expanded γδ T cells. (B) CD4+ T cells were cultured with autologous CD14+ cells loaded with FMDV Ag and cultured in the absence (hatched histogram) or presence (white histogram) of in vitro–expanded γδ T cells. Gray histogram shows spontaneous proliferation without stimulus. Histograms are representative samples of cells from six different animals analyzed in duplicate. (C and D) Bar graphs showing nonspecific (IL-2, anti-CD3, anti-CD28–driven) (C) and FMDV Ag-specific (D) proliferation of CD4+ T cells in the presence or absence of in vitro–expanded γδ T cells. Spontaneous proliferation to culture media is also shown. Bars indicate means (n = 6), and error bars indicate SDs. (EG) CD8+ T cells cultured with autologous CD14+ cells loaded with FMDV Ag and cultured in the absence (E) or presence (F) of in vitro–expanded γδ T cells were stained for intracellular IFN-γ and perforin, and analyzed by flow cytometry. (G) Isotype and fluorochrome controls of intracellular staining are shown. Data are representative of cells obtained from six different animals and analyzed in duplicate. (H) Bar graph showing a reduction in cytokine expression in FMDV-specific CD8+ T cells in the presence of in vitro–expanded γδ T cells. Spontaneous cytokine expression to culture media is also shown. Bars indicate means (n = 6), and error bars indicate SEMs.
FIGURE 6.
FIGURE 6.
Monocyte/macrophages and MoDCs express IL-10 and TGF-β, and induce proliferation of IL-10+ γδ T cells. Peripheral blood monocyte/macrophages expressing CD14 (A) and expression of MHC class II/CD1b (B) in CD14+ cells. After a 3-d culture in the presence of GM-CSF and IL-4, the cells increased expression of MHC class II and CD1b (C). IL-10 and TGF-β expression in ex vivo CD14+ cells (D) and cultured MoDCs (E). Both monocyte/macrophages and MoDCs induced the expansion of autologous IL-10–expressing γδ T cells (F). Bar graph shows means (n = 10) and error bars indicate SEMs. Representative plots of cells obtained from 10 different animals analyzed in duplicate. Quadrants were placed based on isotype and fluorochrome controls.
FIGURE 7.
FIGURE 7.
CD8α+ SIRPα+ lung-resident DCs express cytokines that induce γδ T cells with suppressive phenotype. Phenotypic analysis of bovine lung DC subsets includes FSChigh MHC class II (A), SIRPα and CD11c (B), and SIRPα and CD8α (C). Cells were fixed, permeabilized, and stained for intracellular TGF-β and IL-10. DCs were gated on SIRPα CD8α double negatives (D), SIRPα CD8α+ single positives (E), and SIRPα+ CD8α+ double positive (F). Dot plots are representative of tissues from six different animals. (GI) SIRPα+ CD8α+ lung DCs are capable of inducing γδ T cells with suppressive phenotype. (G) Subpopulations of lung-resident DCs were FACS sorted and cocultured with autologous MACS-sorted γδ TCR+ T cells for 5 d. Proliferation was analyzed by CFSE dilution, and cells were stained for intracellular IL-10. (H) FMDV-specific proliferation of CD4+ T cells in the absence or presence of in vitro–expanded γδ T cells by SIRPα+ CD8+ lung DCs and in Transwell plates with or without blocking anti–IL-10. (I) FMDV-specific IFN-γ responses in CD4+ T cells in the presence or absence of in vitro–expanded autologous γδ T cells SIRPα+ CD8+ lung DCs and in Transwell plates with or without blocking anti–IL-10. Bars indicate means of cells from four different animals analyzed in triplicate, and error bars indicate SEMs.
FIGURE 8.
FIGURE 8.
CD8α SIRPα ALDCs express cytokines that induce γδ T with a regulatory phenotype. Phenotypic analysis of bovine ALDC subsets includes FSChigh MHC class II (A), SIRPα and CD11c (B), and SIRPα and CD8α (C). Cells were fixed, permeabilized, and stained for intracellular TGF-β and IL-10. DCs were gated on SIRPα+ CD8α (D), SIRPα+ CD8α+ (E), and SIRPα CD8α double negative (F). Dot plots are representative of cells from five different animals. (GI) SIRPα CD8α ALDCs are capable of inducing γδ T cells with suppressive phenotype. (G) Subpopulations of ALDCs were FACS sorted and cocultured with autologous MACS-sorted γδ TCR+ T cells for 5 d. Proliferation was measured by CFSE dilution and intracellular staining of IL-10 by flow cytometry. (H) FMDV-specific proliferation of CD4+ T cells in the absence or presence of in vitro–expanded autologous γδ T cells by SIRPα CD8α ALDCs and in Transwell plates with or without blocking anti–IL-10. (I) FMDV-specific IFN-γ responses in CD4+ T cells in the presence or absence of in vitro–expanded autologous γδ T cells SIRPα CD8α ALDCs and in Transwell plates with or without blocking anti–IL-10. Bars indicate means of cells from four different animals analyzed in triplicate, and error bars indicate SEMs.
FIGURE 9.
FIGURE 9.
MVA induces the production of IL-10–expressing γδ T cells. FACS-sorted ALDCs were infected with MVA-GFP (dotted histograms) transduced with AdV5-GFP (white histograms) or mock infected (gray histograms). (A) Surface expression of CD40 and (B) MHC class II. Histograms are representative samples of cells from six different animals. Culture supernatants from monocytes (white bars) or ALDCs (gray bars) were analyzed by ELISA for the presence of (C) IL-10 and (D) IL-12. (E) FACS-sorted ALDCs (from A and B) were cultured with autologous CFDA-SE–labeled PBMCs (ratio of 10 PBMC:1 γδ T cell), and lymphocyte proliferation, T cell subsets, and intracellular cytokines were measured by flow cytometry. Bars indicate means of cells obtained from six different animals and tested in duplicate, and error bars indicate SEMs.

Similar articles

Cited by

References

    1. Komori H. K., Meehan T. F., Havran W. L. 2006. Epithelial and mucosal gamma delta T cells. Curr. Opin. Immunol. 18: 534–538. - PubMed
    1. Kabelitz D., Peters C., Wesch D., Oberg H. H. 2013. Regulatory functions of γδ T cells. Int. Immunopharmacol. 16: 382–387. - PubMed
    1. Pang D. J., Neves J. F., Sumaria N., Pennington D. J. 2012. Understanding the complexity of γδ T-cell subsets in mouse and human. Immunology 136: 283–290. - PMC - PubMed
    1. Davis W. C., Brown W. C., Hamilton M. J., Wyatt C. R., Orden J. A., Khalid A. M., Naessens J. 1996. Analysis of monoclonal antibodies specific for the gamma delta TcR. Vet. Immunol. Immunopathol. 52: 275–283. - PubMed
    1. Holm D., Fink D. R., Grønlund J., Hansen S., Holmskov U. 2009. Cloning and characterization of SCART1, a novel scavenger receptor cysteine-rich type I transmembrane molecule. Mol. Immunol. 46: 1663–1672. - PubMed

Publication types

MeSH terms