Review
. 2014 Jun 2;4(6):a017236.
doi: 10.1101/cshperspect.a017236.

Clinical characteristics and current treatment of glaucoma

Affiliations
Review

Clinical characteristics and current treatment of glaucoma

Laura P Cohen et al. Cold Spring Harb Perspect Med. .

Abstract

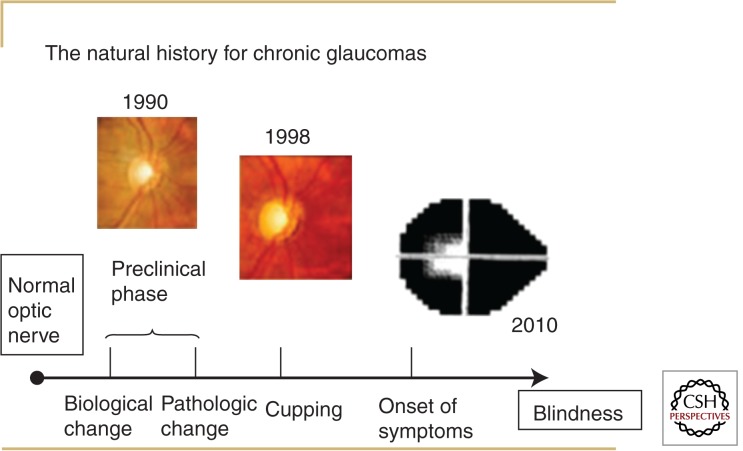
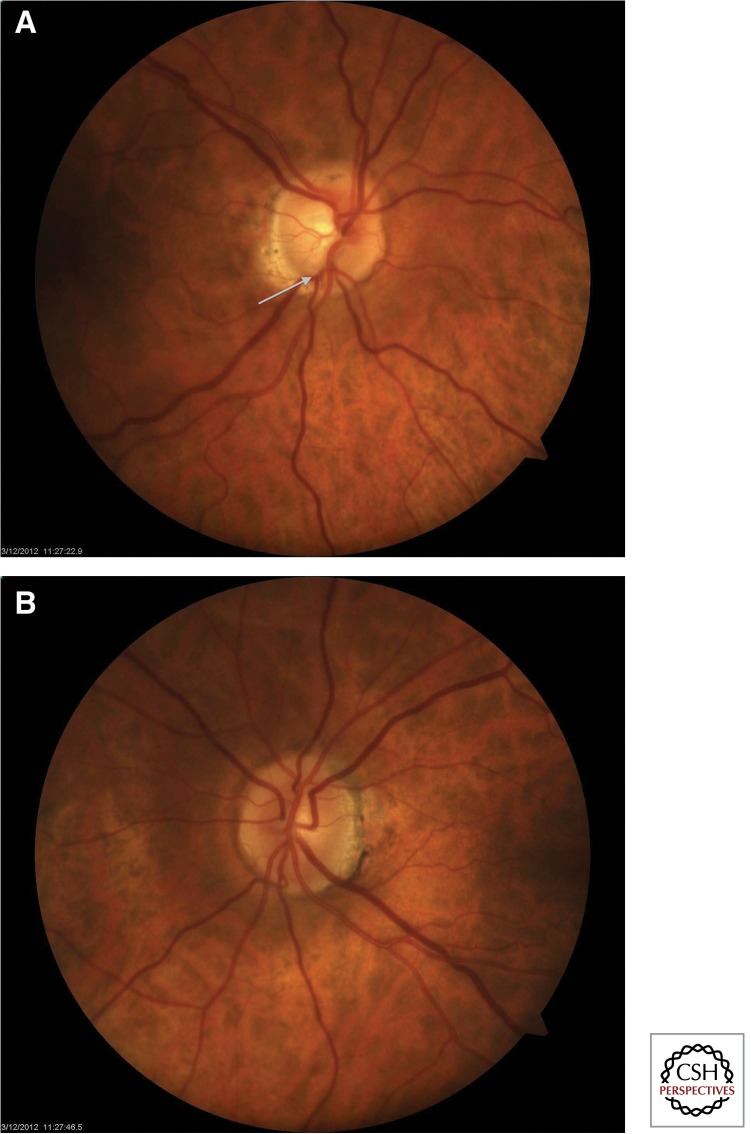
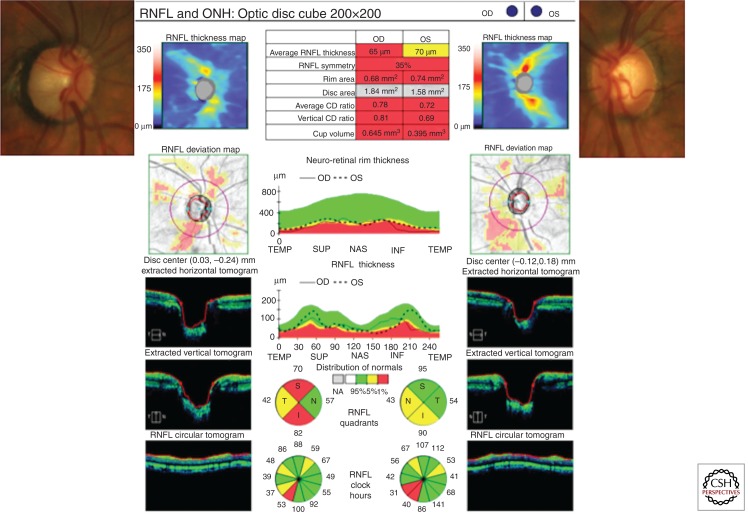
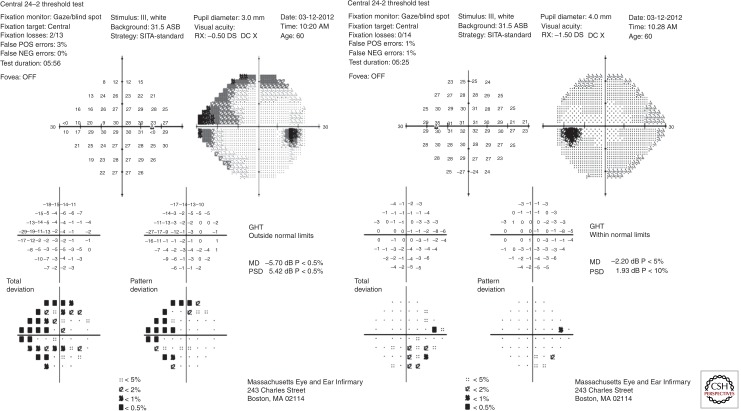
Glaucoma is a neurodegenerative disorder in which degenerating retinal ganglion cells (RGC) produce significant visual disability. Clinically, glaucoma refers to an array of conditions associated with variably elevated intraocular pressure (IOP) that contributes to RGC loss via mechanical stress, vascular abnormalities, and other mechanisms, such as immune phenomena. The clinical diagnosis of glaucoma requires assessment of the ocular anterior segment with slit lamp biomicroscopy, which allows the clinician to recognize signs of conditions that can produce elevated IOP. After measurement of IOP, a specialized prismatic lens called a gonioscope is used to determine whether the angle is physically open or closed. The structural manifestation of RGC loss is optic nerve head atrophy and excavation of the neuroretinal rim tissue. Treatment is guided by addressing secondary causes for elevated IOP (such as inflammation, infection, and ischemia) whenever possible. Subsequently, a variety of medical, laser, and surgical options are used to achieve a target IOP.


Figures

Figure 1.
Figure 1.
Natural history for chronic glaucomas. In the natural history of chronic glaucoma, there is a poorly defined preclinical phase that manifests here as enlargement of the vertical cup–disc ratio from 1990 to 1998. Symptoms typically develop late in the disease course, as depicted by the patient with advanced visual field loss in 2010.
Figure 2.
Figure 2.
Erosion of rim tissue in glaucomatous optic nerve. (A) The fundus photo of this glaucomatous right eye shows vertical extension of the cup to the inferior margin of the disc (white arrow). The vertical cup–disc ratio is 0.7. (B) The fellow eye shows a disc with intact neuroretinal rims and a cup–disc ratio of 0.3.
Figure 3.
Figure 3.
The insets on the upper right and left illustrate optic nerves with pathologic cupping. The spectral domain optical coherence tomogram (SD-OCT) assigned a vertical cup–disc ratio (CDR) of 0.81 for the right optic nerve and 0.69 for the left optic nerve. The SD-OCT also measures other optic nerve structural parameters such as rim area and cup volume. The rim area is abnormally low and the cup volume is abnormally large for both eyes compared to an age-matched control; hence they are highlighted in red. These abnormal values reflect loss of retinal ganglion cell axons. The SD-OCT also measures average retinal nerve fiber layer (RNFL) thickness in a swath of tissue around the optic nerve. It is significantly thinner in the right eye and borderline thinner in the left eye compared to an age-matched control. The nerve fiber layer thickness map assigns areas of thicker nerve fiber layer tissue with red and yellow colors and assigns areas where RNFL is thin with blue colors. Normally the nerve fiber layer is thickest at the superior and inferior pole and thinnest at 3 o’clock and 9 o’clock. Abnormal blue color adjacent to the inferior pole of the right eye corresponds to extension of the inferior cup to the neuroretinal rim on the optic nerve photo. The nerve fiber layer deviation map highlights regional areas where the nerve fiber layer is thin compared to an age matched control. Extracted horizontal and vertical tomograms provide cross-sectional views of the optic nerves, illustrating the abnormally large cup volume in both eyes. There is also an anatomical reconstruction of a circular swath of tissue around the optic nerve corresponding to the red circle drawn on the nerve fiber layer deviation map. The middle tile provides regional inter-eye comparisons as well as comparisons to a normative database for neuroretinal rim thickness and nerve fiber layer thickness. These graphs illustrate that nerve fiber layer loss is greater in the right optic nerve where the CDR is larger. Other abbreviations used: ONH, optic nerve head; T, temporal; N, nasal; S, superior; I, inferior; TEMP, temporal; SUP, superior; NAS, nasal; INF, inferior.
Figure 4.
Figure 4.
A Humphrey visual field for the patient illustrated in Figure 3 shows acceptable reliability parameters in both eyes (fixation loss ≤33%; false positive and false negative rates ≤20%). Raw retinal sensitivity data in decibels (converted from an apostilb scale ranging from 0 to 10,000 candela/m2) are provided. The grayscale representation illustrates the blind spots corresponding to the optic nerves, where there are no light-sensitive cells. These raw data are compared to a normative database to generate a Total Deviation plot. For each point, the probability that the sensitivity difference versus an age-matched control is statistically different is provided. In the Pattern Deviation plot the general reduction in retinal sensitivity is factored out to yield focal defects in the visual field. The right eye shows superior and inferior nasal defects in the peripheral visual field. Interestingly the left eye, which showed structural loss, has minimal loss of visual field. Other abbreviations used: GHT, glaucoma hemifield test; MD, mean deviation; PSD, pattern standard deviation.

References

    1. Abe H, Hasegawa S, Iwata K 1987. Contrast sensitivity and pattern visual evoked potential in patients with glaucoma. Doc Ophthalmol 65: 65–70 - PubMed
    1. Aggarwal RK, Potamitis T, Chong NH, Guarro M, Shah P, Kheterpal S 1993. Extensive visual loss with topical facial steroids. Eye (Lond) 7: 664–666 - PubMed
    1. Anderson DR 2003. Collaborative normal tension glaucoma study. Curr Opin Ophthalmol 14: 86–90 - PubMed
    1. Bianchi-Marzoli S, Rizzo JF III, Brancato R, Lessell S 1995. Quantitative analysis of optic disc cupping in compressive optic neuropathy. Ophthalmology 102: 436–440 - PubMed
    1. Boland MV, Ervin AM, Friedman DS, Jampel HD, Hawkins BS, Vollenweider D, Chelladurai Y, Ward D, Suarez-Cuervo C, Robinson KA 2013. Comparative effectiveness of treatments for open-angle glaucoma: A systematic review for the U.S. Preventive Services Task Force. Ann Intern Med 158: 271–279 - PubMed

LinkOut - more resources