. 2014 Sep;69(9):819-25.
doi: 10.1136/thoraxjnl-2013-204980. Epub 2014 Jun 2.

Human mesenchymal stem cells reduce the severity of acute lung injury in a sheep model of bacterial pneumonia

Affiliations

Human mesenchymal stem cells reduce the severity of acute lung injury in a sheep model of bacterial pneumonia

Sven Asmussen et al. Thorax. 2014 Sep.

Abstract

Background: Human bone marrow-derived mesenchymal stem (stromal) cells (hMSCs) improve survival in mouse models of acute respiratory distress syndrome (ARDS) and reduce pulmonary oedema in a perfused human lung preparation injured with Escherichia coli bacteria. We hypothesised that clinical grade hMSCs would reduce the severity of acute lung injury (ALI) and would be safe in a sheep model of ARDS.

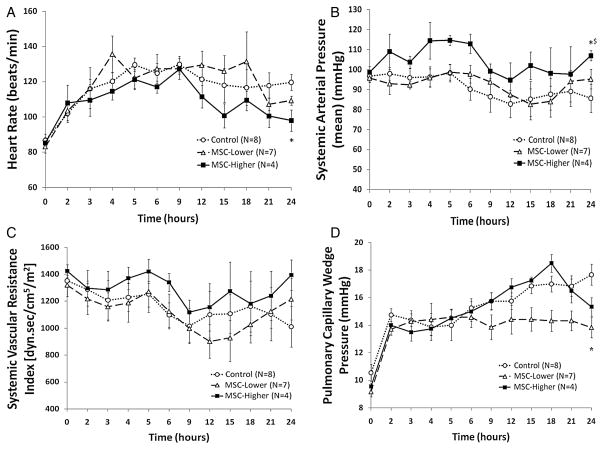
Methods: Adult sheep (30-40 kg) were surgically prepared. After 5 days of recovery, ALI was induced with cotton smoke insufflation, followed by instillation of live Pseudomonas aeruginosa (2.5×10(11) CFU) into both lungs under isoflurane anaesthesia. Following the injury, sheep were ventilated, resuscitated with lactated Ringer's solution and studied for 24 h. The sheep were randomly allocated to receive one of the following treatments intravenously over 1 h in one of the following groups: (1) control, PlasmaLyte A, n=8; (2) lower dose hMSCs, 5×10(6) hMSCs/kg, n=7; and (3) higher-dose hMSCs, 10×10(6) hMSCs/kg, n=4.

Results: By 24 h, the PaO2/FiO2 ratio was significantly improved in both hMSC treatment groups compared with the control group (control group: PaO2/FiO2 of 97±15 mm Hg; lower dose: 288±55 mm Hg (p=0.003); higher dose: 327±2 mm Hg (p=0.003)). The median lung water content was lower in the higher-dose hMSC-treated group compared with the control group (higher dose: 5.0 g wet/g dry [IQR 4.9-5.8] vs control: 6.7 g wet/g dry [IQR 6.4-7.5] (p=0.01)). The hMSCs had no adverse effects.

Conclusions: Human MSCs were well tolerated and improved oxygenation and decreased pulmonary oedema in a sheep model of severe ARDS.

Trail registration number: NCT01775774 for Phase 1. NCT02097641 for Phase 2.

Keywords: ARDS.


Conflict of interest statement

Competing interests None.

Figures

Figure 1
Figure 1
(A) Heart rate in sheep treated with PlasmaLyte A alone (control) (T0: n=8; T24: n=6), lower-dose hMSCs (5×10⁶ cells/kg) (T0: n=7; T24: n=6) and higher-dose hMSCs (10×106 cells/kg) (T0: n=4; T24: n=3).*p=0.01 in the higher-dose hMSC group vs the control group at 24 h by ANCOVA. There were no significant differences among the treatment groups by the GEE. Data are expressed as mean±SEM. (B) Systemic arterial blood pressure (MAP) (mean) in sheep treated with PlasmaLyte A alone (control) (T0: n=8; T24: n=6), lower-dose hMSCs (5×10⁶ cells/kg) (T0: n=7; T24: n=6) and higher-dose hMSCs (10×106 cells/kg) (T0: n=4; T24: n=3). *p=0.004 in the higher-dose hMSC group vs the control group at 24 h by ANCOVA. $p<0.05 in the higher-dose hMSC group vs the control group during the 24 h period by the GEE. There was no significant difference between the lower-dose hMSC group and the control group by the GEE. Data are expressed as mean±SEM. (C) Systemic vascular resistance index (SVRI in sheep treated with PlasmaLyte A alone (control) (T0: n=8; T24: n=6), lower-dose hMSCs (5×10⁶ cells/kg) (T0: n=7; T24: n=6) and higher-dose hMSCs (10×106 cells/kg) (T0: n=4; T24: n=3). No difference was found among the three groups at 24 h by ANCOVA or during the 24 h by the GEE. Data are expressed as mean±SEM. (D) Pulmonary capillary wedge pressure (PCWP) in sheep treated with PlasmaLyte A alone (control) (T0: n=8; T24: n=6), lower-dose hMSCs (5×10⁶ cells/kg) (T0: n=7; T24: n=6) and higher-dose hMSCs (10×106 cells/kg) (T0: n=4; T24: n=3). *p=0.007 in lower-dose hMSC-treated sheep compared with control sheep by ANCOVA at 24 h. There were no significant differences among the treatment groups by the GEE. Data are expressed as mean±SEM.
Figure 2
Figure 2
(A) Pulmonary arterial pressure (PAP) in sheep treated with PlasmaLyte A alone (control) (T0: n=8; T24: n=6), lower-dose hMSCs (5×10⁶ cells/kg) (T0: n=7; T24: n=6) and higher-dose hMSCs (10×106 cells/kg) (T0: n=4; T24: n=3). *p=0.008 in higher-dose hMSC-treated sheep compared with control sheep by ANCOVA at 24 h. #p<0.001 in lower-dose hMSC-treated sheep compared with control sheep by ANCOVA at 24 h. $p=0.04 in the higher-dose hMSC group vs the control group during the 24 h period by the GEE. There was no significant difference between the lower-dose hMSC group and the control group by the GEE. Data are expressed as mean±SEM. (B) Pulmonary vascular resistance index (PVRI) in sheep treated with PlasmaLyte A alone (control) (T0: n=8; T24: n=6), lower-dose hMSCs (5×10⁶ cells/kg) (T0: n=7; T24: n=6) and higher-dose hMSCs (10×106 cells/kg) (T0: n=4; T24: n=3). No difference was found among the three groups at 24 h by ANCOVA. There were no significant differences among the treatment groups by the GEE. Data are expressed as mean±SEM.
Figure 3
Figure 3
(A) Peak airway pressure in sheep treated with PlasmaLyte A alone (control) (T0: n=8; T24: n=6), lower-dose hMSCs (5×10⁶ cells/kg) (T0: n=7; T24: n=6) and higher-dose hMSCs (10×106 cells/kg) (T0: n=4; T24: n=3). There were no statistical differences in the lower-dose and higher-dose hMSC-treated sheep vs control sheep by ANCOVA at 24 h. There were no significant differences among the treatment groups by the GEE. Data are expressed as mean±SEM. (B) Pause airway pressure in sheep treated with PlasmaLyte A alone (control) (T0: n=8; T24: n=6), lower-dose hMSCs (5×10⁶ cells/kg) (T0: n=7; T24: n=6) and higher-dose hMSCs (10×106 cells/kg) (T0: n=4; T24: n=3). There were no differences in the lower and higher hMSC-treated groups vs the control group at 24 h by ANCOVA or during the 24 h experiment period by the GEE. Data are expressed as mean±SEM.
Figure 4
Figure 4
Total fluid balance (fluid in—urine output) in mL over the 24 h period in sheep treated with PlasmaLyte A alone (control) (n=8), lower-dose hMSCs (5×10⁶ cells/kg) (n=7) and higher-dose hMSCs (10×106 cells/kg) (n=4). There were no differences among the three groups by Kruskal–Wallis equality-of-populations rank test. Data are expressed as median with 25–75% centiles.
Figure 5
Figure 5
The PaO2/FiO2 ratio (mmHg) in sheep treated with PlasmaLyte A alone (control) (T0: n=8; T24: n=6), lower-dose hMSCs (5×10⁶ cells/kg) (T0: n=7; T24: n=6) (n=7) and higher-dose hMSCs (10×106 cells/kg) (T0: n=4; T24: n=3) (n=4). *p=0.003 in higher-dose hMSC-treated sheep compared with control sheep by ANCOVA at 24 h. #p=0.003 in lower-dose hMSC-treated sheep compared with control sheep by ANCOVA at 24 h. There were no significant differences among treatment groups over the 24 h period by the GEE. Data are expressed as mean±SEM.
Figure 6
Figure 6
Postmortem lung bloodless wet/dry weight ratio in sheep treated with PlasmaLyte A alone (control) (n=8), lower-dose hMSCs (5×10⁶ cells/kg) (n=7) and higher-dose hMSCs (10×106 cells/kg) (n=4). *p=0.01 in higher-dose hMSC-treated sheep compared with control group by Mann–Whitney rank-sum test with Bonferroni adjustments. Data are expressed as median with 25–75% centiles.

Similar articles

Cited by

References

    1. Matthay MA, Ware LB, Zimmermann GA. The acute respiratory distress syndrome. J Clin Invest. 2012;122:2731–40. - PMC - PubMed
    1. Ware LB, Matthay MA. Acute respiratory distress syndrome. N Engl J Med. 2000;342:1334–49. - PubMed
    1. Eisner MD, Thompson T, Hudson LD, et al. Efficacy of low tidal volume ventilation in patients with different clinical risk factors for acute lung injury and the acute respiratory distress syndrome. Am J Respir Crit Care Med. 2001;164:231–6. - PubMed
    1. ARDS definition task force. Acute respiratory distress syndrome: the Berlin Definition. JAMA. 2012;307:2526–33. - PubMed
    1. Amato MB, Barbas CS, Medeiros DM, et al. Effect of a protective-ventilation strategy on mortality in the acute respiratory distress syndrome. N Engl J Med. 1998;338:347–54. - PubMed

Publication types

MeSH terms

Substances

Associated data